
Know which marketing channels actually drive revenue.
Know which marketing channels
actually drive revenue.
78% of marketing decision-makers believe at least 10% of spend is wasted. The average organization wastes 25% of its budget on efforts that do not drive revenue.
The status quo already costs well over $8,000 per month (pipeline, BI, attribution tool, and an analyst). That is money you spend today, not a comparison to another product.
Marketing teams spend an average of 14.5 hours per week collecting and preparing data.
What the status quo already costs you.
The alternative is not another product. It is the tools, pipeline, and people you already pay for.
| Component | Monthly cost |
|---|---|
| Data pipeline | ~$549/month |
| BI layer | ~$150+/month |
| Attribution platform | $1,500+/month |
| Marketing data analyst | ~$5,800 to $7,750/month |
| What you pay today | well over $8,000/month |
Pipeline, BI, and attribution figures are vendor list prices. Analyst cost is derived from a $70,000 to $93,000 annual salary (PayScale, Glassdoor 2026).
See what you are losing.
10% is a conservative industry benchmark. 78% of marketing decision-makers believe at least 10% of spend is wasted (Haus, 2026, via eMarketer). The average organization wastes 25% (DemandScience, 2026). Your result depends on your data.
7 Problems Holding Your Marketing Back
The MarTech Stack Mess
54% of CMOs say connecting data from different sources is a major barrier. You have no way to see the full picture without opening 10 tabs.
The ROI Proof Gap
You can't connect spend to revenue because the infrastructure is missing. Your dashboards show success but the bank account is flat.
The Strategic Velocity Gap
Legacy tools carry a 48-hour reporting lag. By the time you see the data, your competitors have already pivoted.
The Executive Trust Gap
The CEO sees a dashboard full of green arrows but the bank account tells a different story. Trust erodes fast.
The Invisible Drain
Marketing teams spend an average of 14.5 hours a week collecting and preparing data instead of optimizing campaigns.
The Technical Translation Trap
CMOs are playing IT support for broken dashboards instead of driving strategy. You should not need a data scientist to get a report.
The Exhaustion Wall
Talent burnout is caused by data drudgery, not workload. Your best people leave because they are drowning in spreadsheets, not strategy.
The Cost of Guessing
In a cut-throat market, guessing is expensive. It costs you market share, budget, and your peace of mind.
Turn Your Data into Your Competitive Advantage
No-Code Data Platform
Stop wrestling with complex tools. Build meaningful reports without writing a single line of SQL.
Unified Marketing Analytics
Connect Google Ads, GA4, and Ad Manager in one view. Break down data silos instantly.
Real-Time ROI Tracking
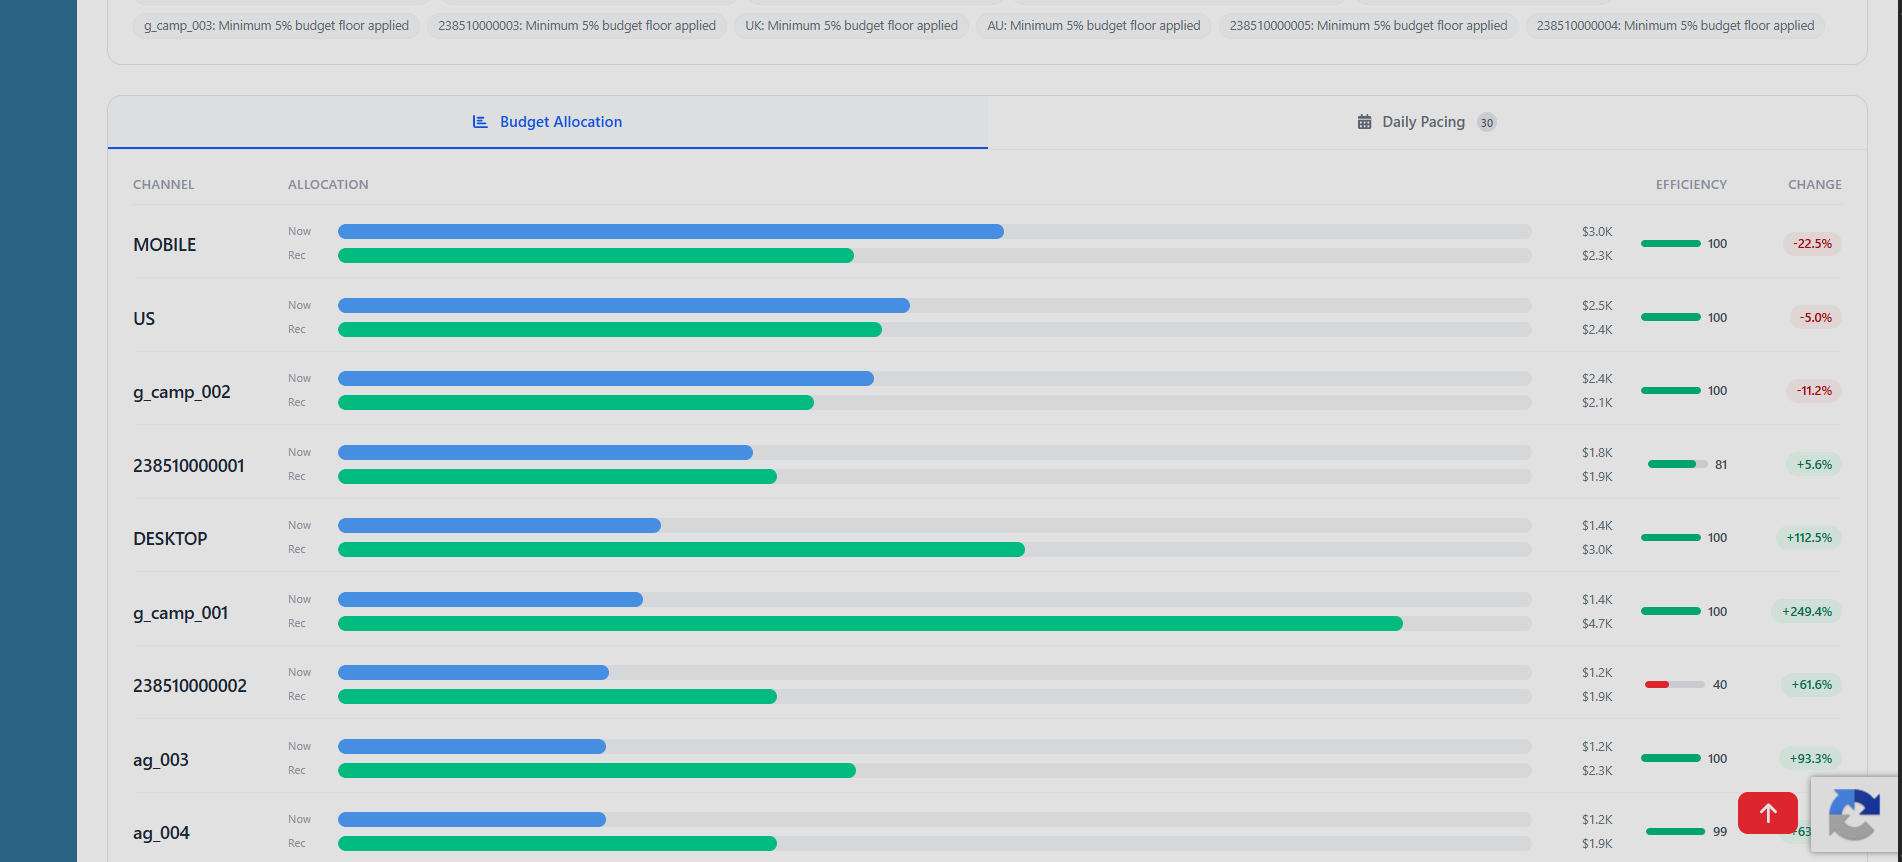
Monitor campaign performance as it happens. Pivot budget instantly to maximize ROAS.
AI-Driven Data Insights
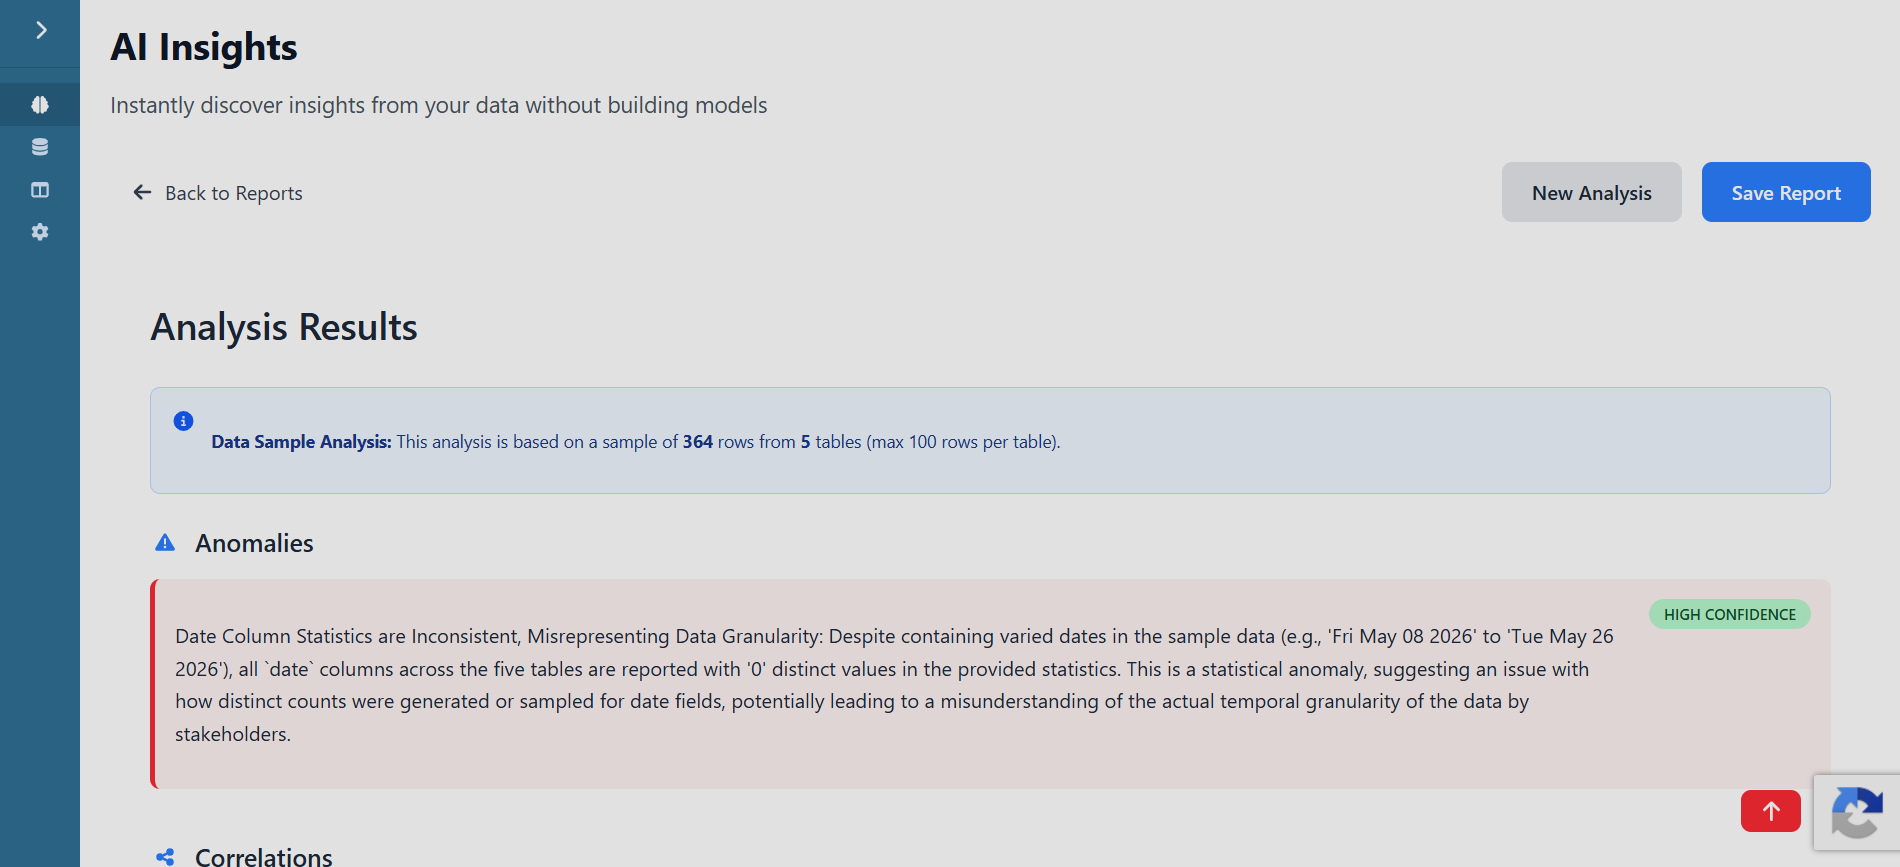
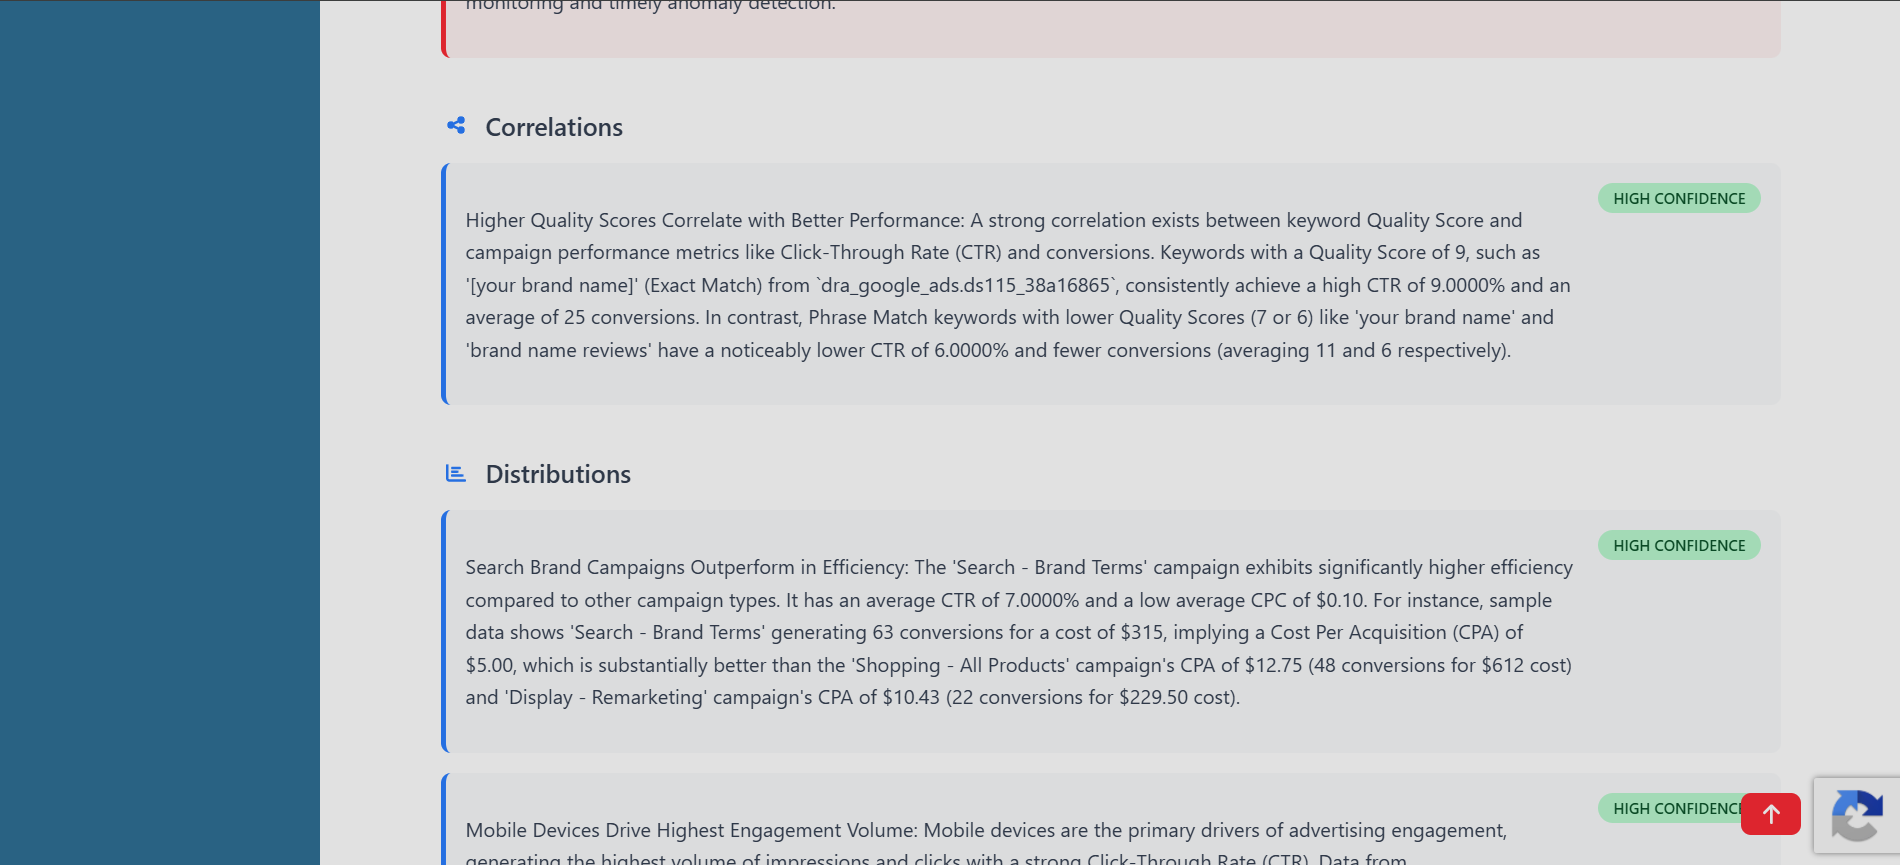
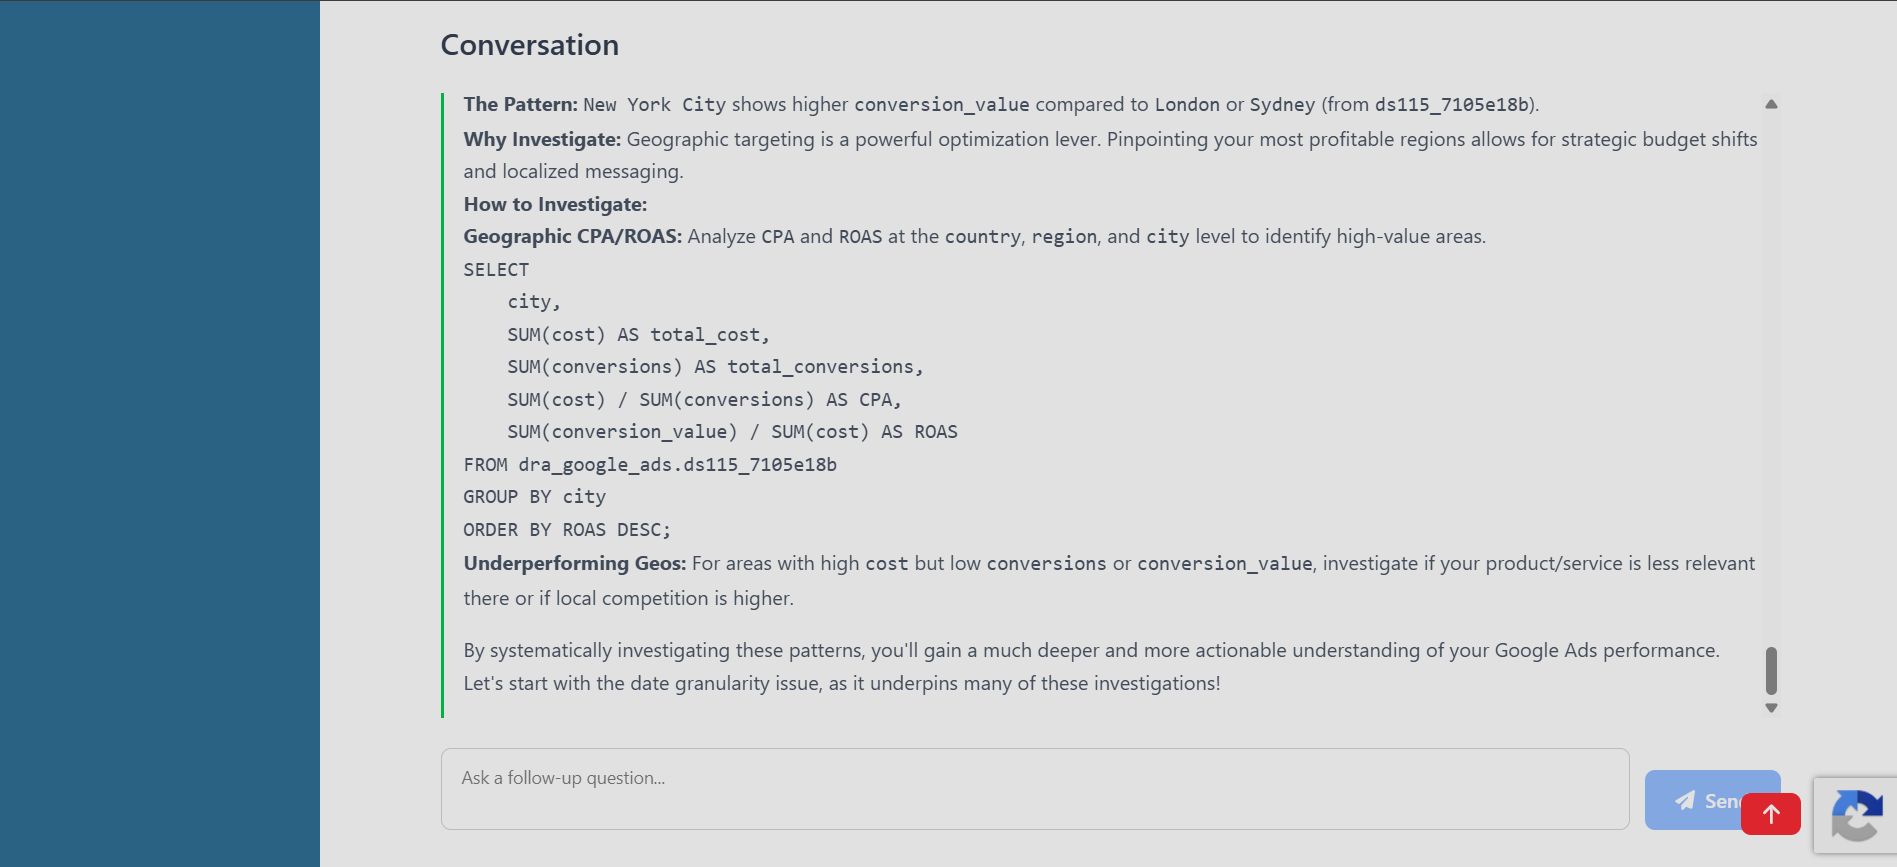
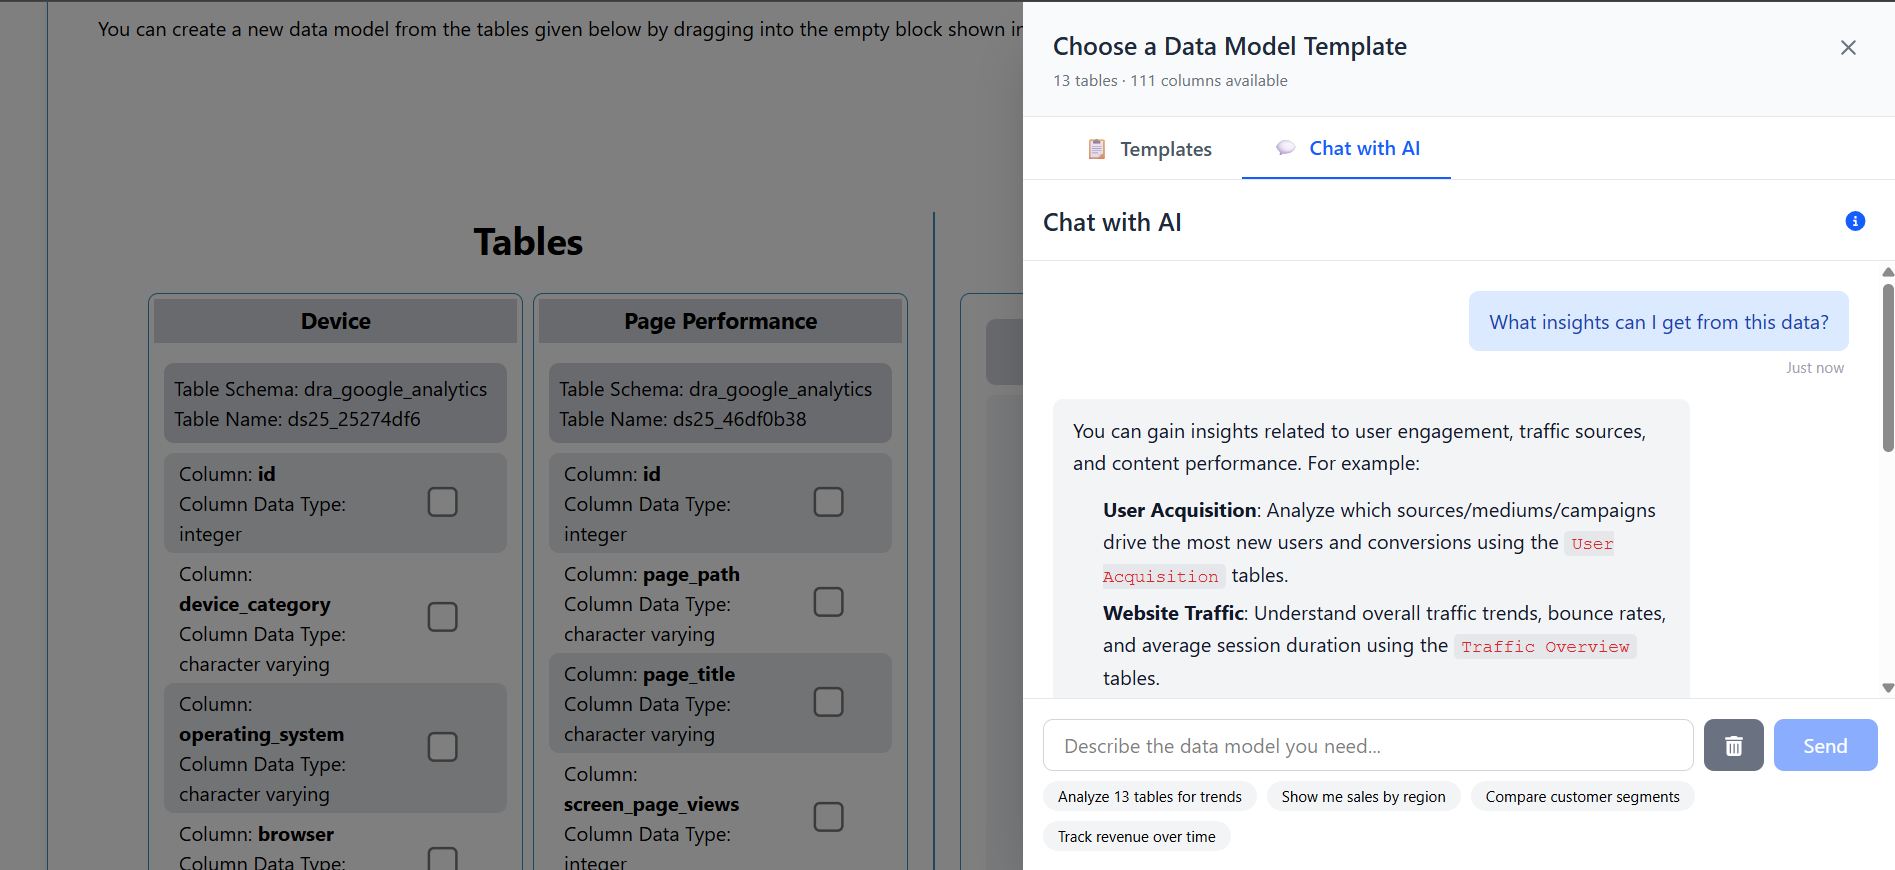
Ask your data questions in plain English. Get instant, CEO-ready answers from our specific AI agents.
Market Intelligence
Layer public datasets over your private data. Spot trends before your competitors do.
Instant Onboarding
Skip the expensive certifications. Our intuitive interface is built for marketers, not data scientists.
From Unified Data to Actionable Reports
Two powerful tools that turn your connected data into decisions — no SQL required.
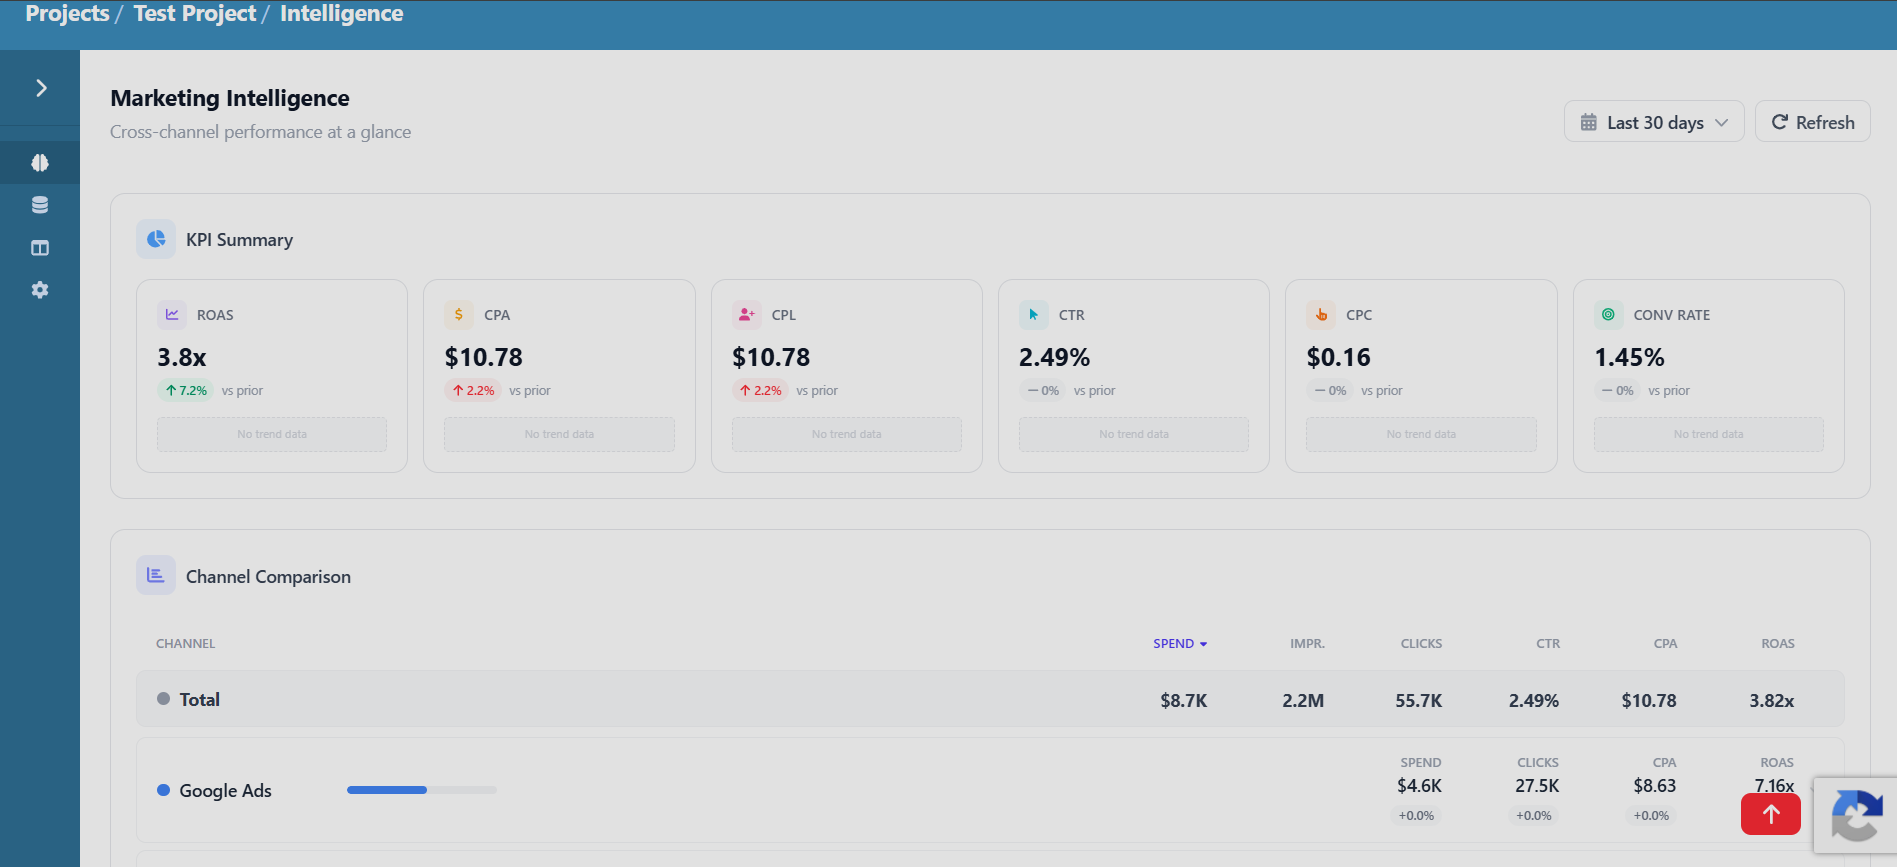
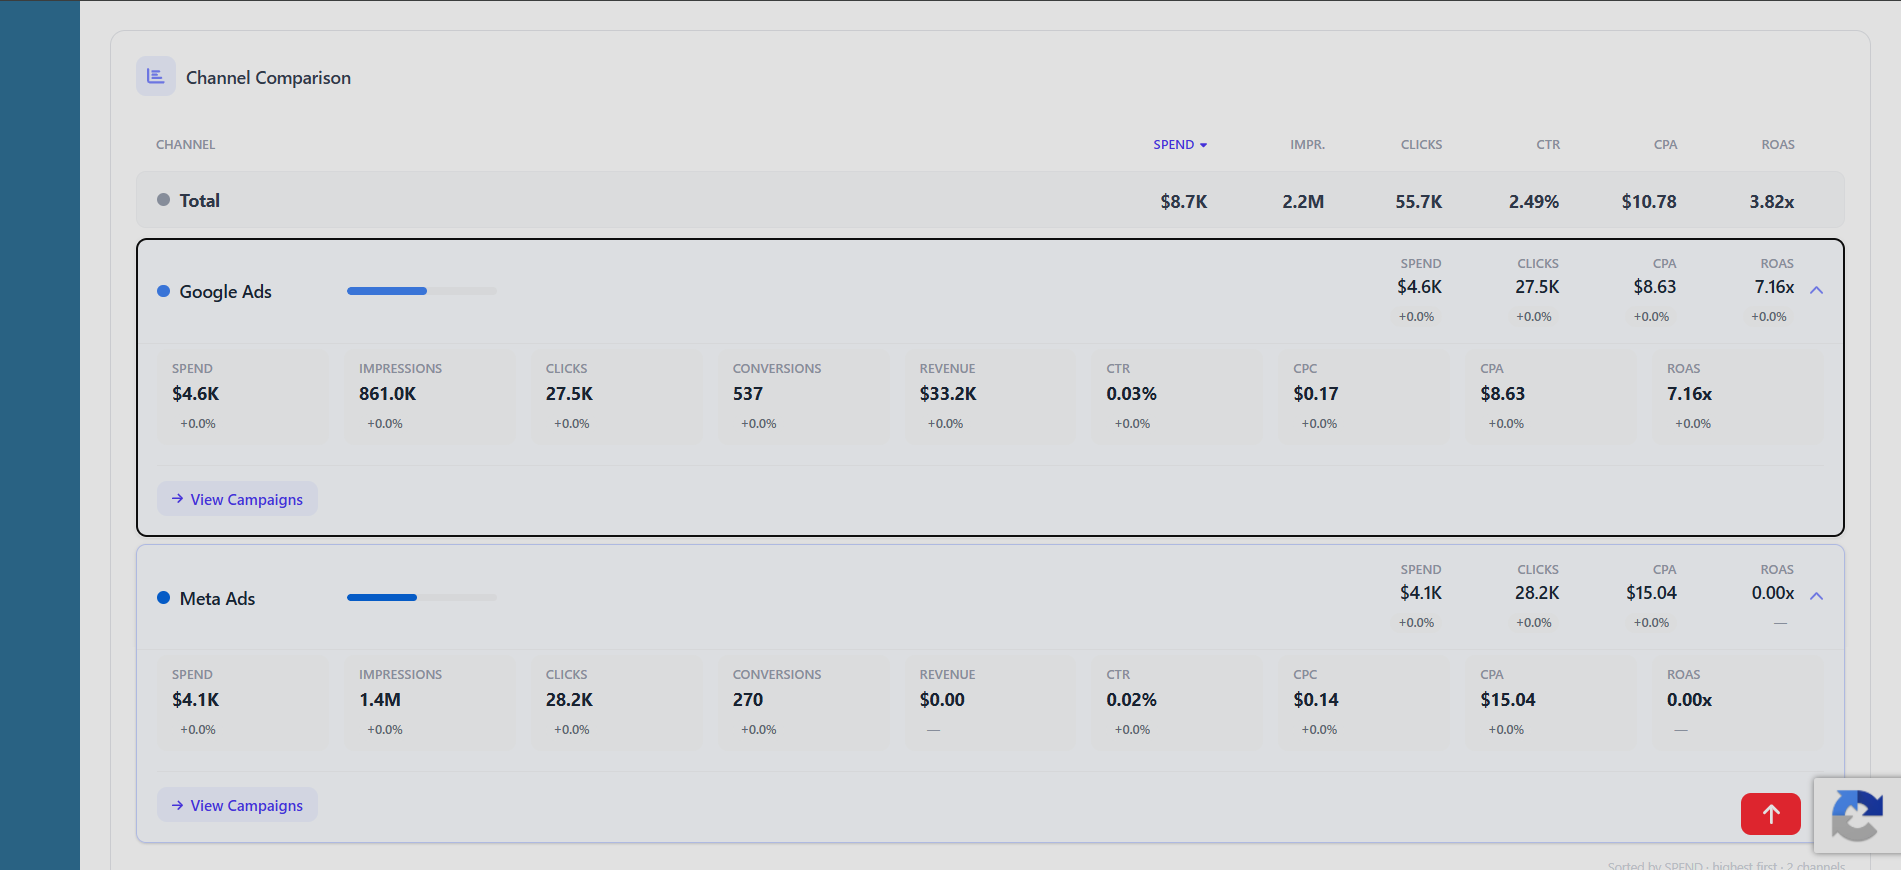
Marketing Intelligence Hub
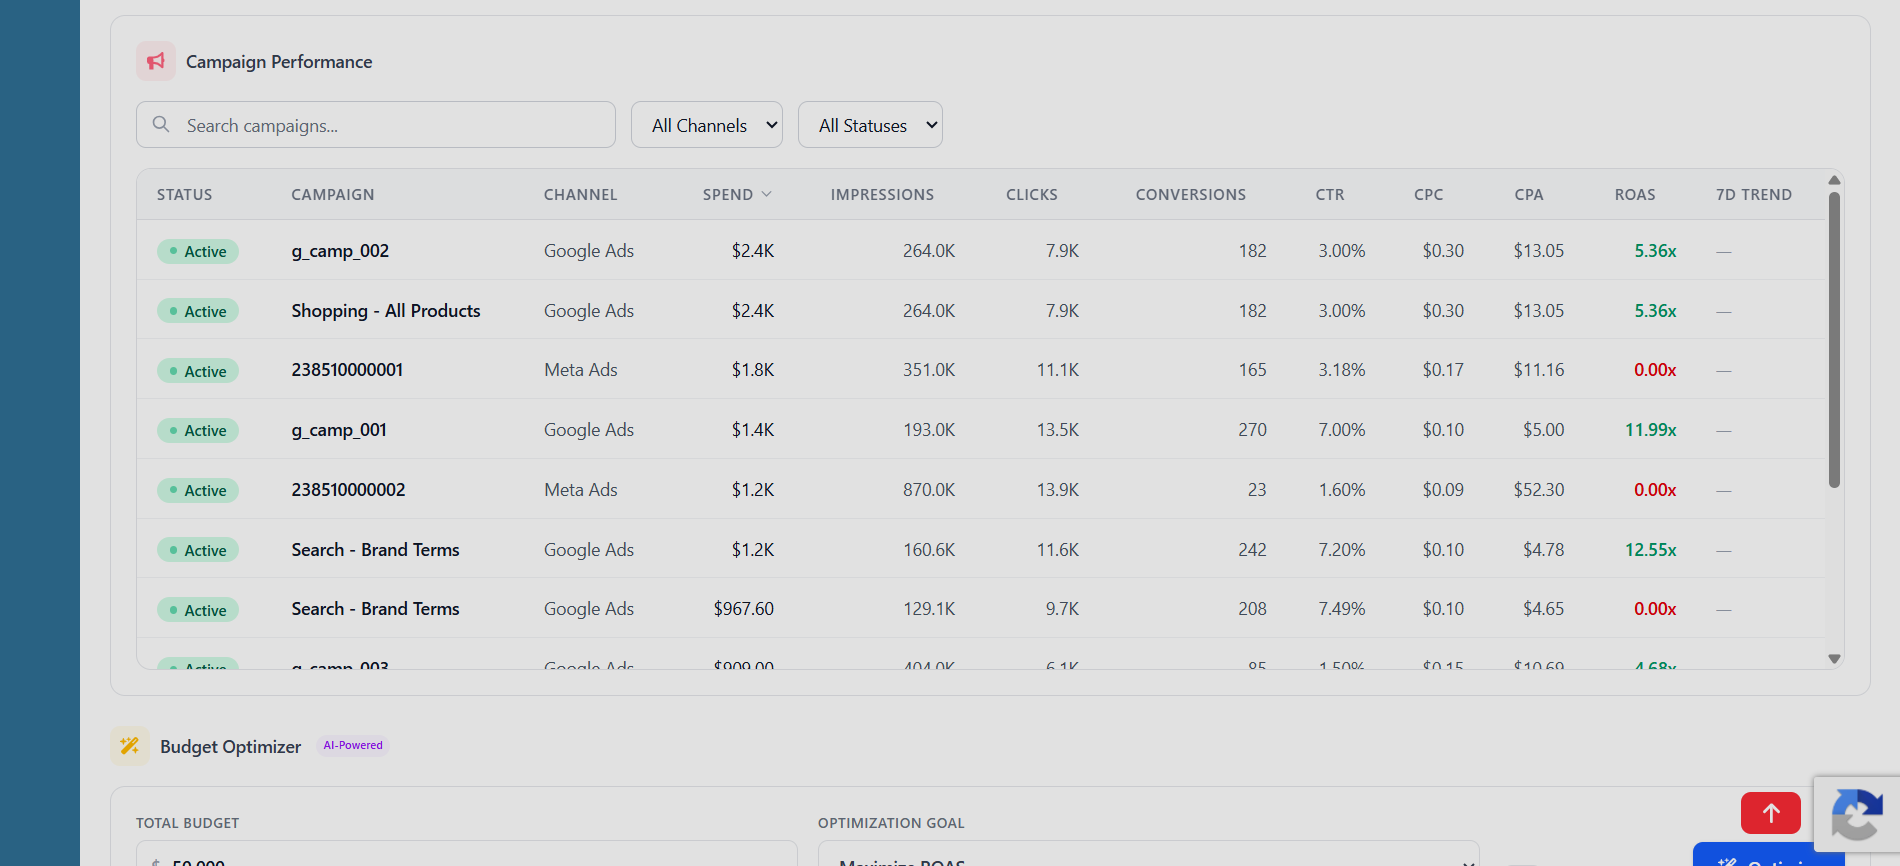
Your command center for cross-channel performance. Track every campaign, channel, and dollar in one unified view.
- Live KPI Dashboard
Spend, impressions, clicks, conversions, CPL, pipeline value — updated in real time.
- Campaign Drill-Downs
Click into any campaign to see granular performance by channel, platform, and creative.
- AI-Powered Alerts
Get notified when spend spikes, conversions drop, or anomalies are detected.
Custom Report Builder
Drag, drop, and design CEO-ready reports in minutes. Combine charts, tables, and AI insights on one canvas.
- Drag-and-Drop Canvas
Add KPI cards, data tables, charts, text blocks, and dashboards to any layout.
- Pre-Built Templates
Start fast with templates for weekly performance, executive summaries, and more.
- Export & Share
Export to PDF, share with stakeholders, or embed live dashboards anywhere.
How It Works
Connect Sources
Sync Google Ads, Analytics, SQL, CSVs in one click.
Analyze
Track KPIs, drill into campaigns, catch anomalies with AI.
Report
Drag and drop custom reports with charts and tables.
Scale
Share insights, pivot budget, grow your brand faster.
Unify Your Entire Marketing Stack In Seconds
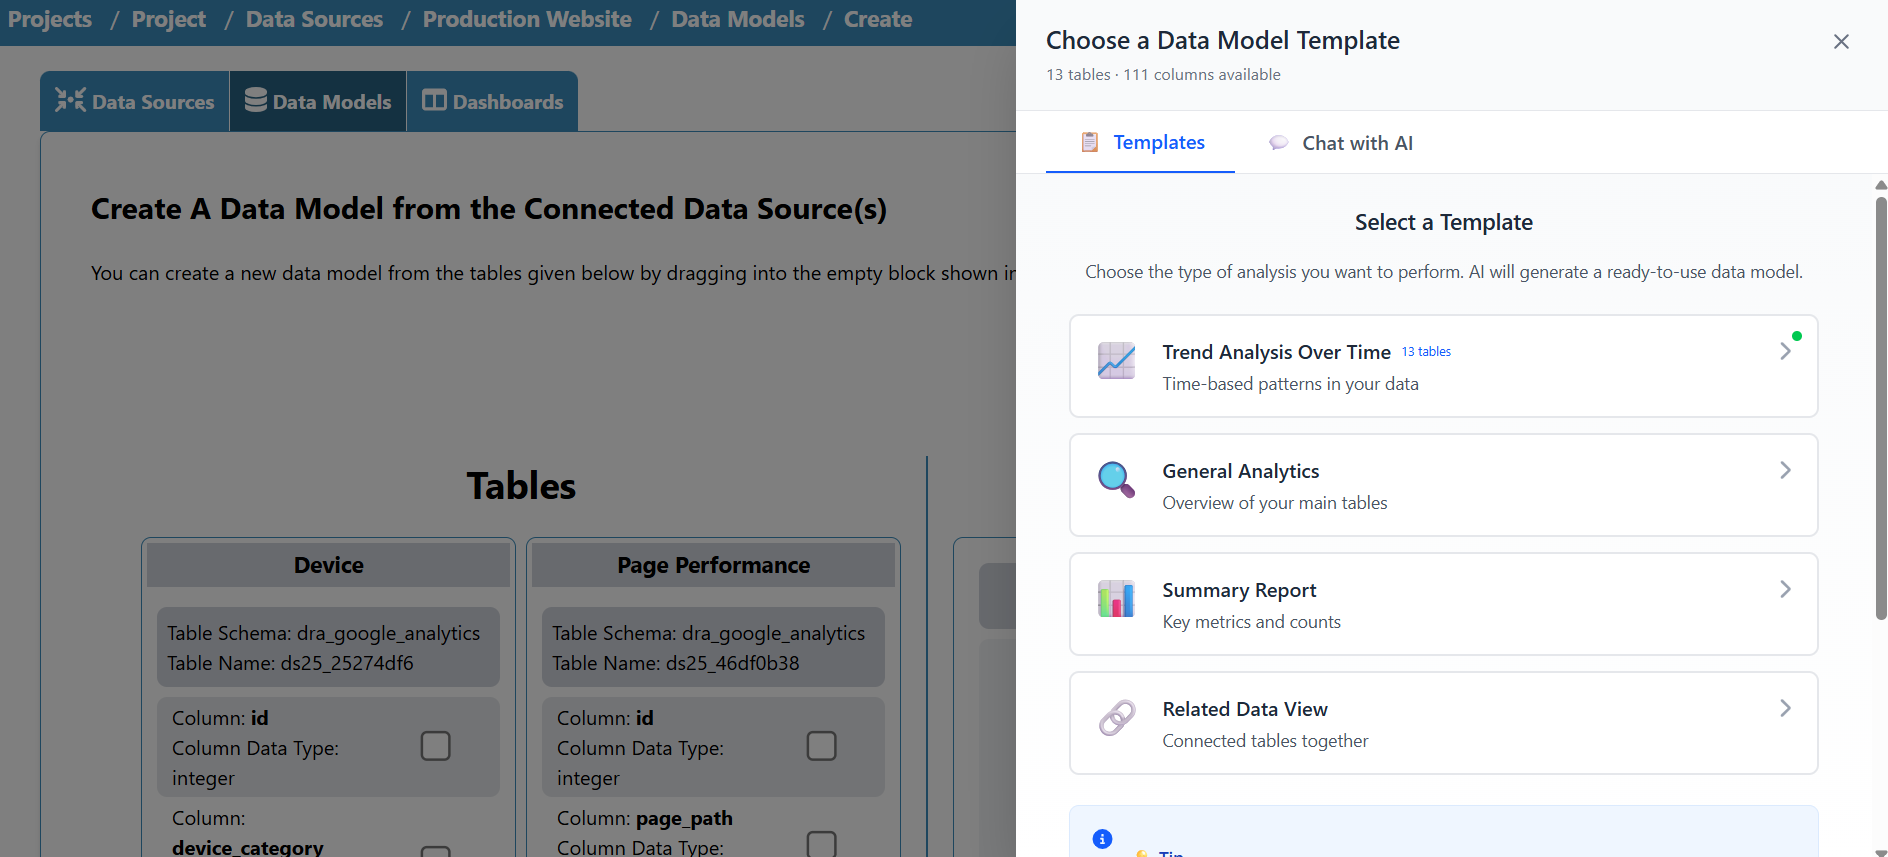
Stop logging into multiple different platforms just to see if your campaigns are working. Data Research Analysis bridges the gap between your ad spend and your results, allowing you to sync your Google Ads, Meta Ads, Analytics, and Ad Manager into one cohesive story. Build a custom data model that finally shows you the big picture without the manual exports.





Stop logging into multiple different platforms just to see if your campaigns are working. Data Research Analysis bridges the gap between your ad spend and your results, allowing you to sync your Google Ads, Meta Ads, Analytics, and Ad Manager into one cohesive story. Build a custom data model that finally shows you the big picture without the manual exports.
Talk To Your Own Private Data Analyst
"Speak to Your Data. Get Answers Instantly."
Imagine having a senior data analyst sitting next to you, ready to answer any question instantly. That’s the AI Data Modeler.
- No more "I'll get back to you on that."
- No more "I need to run a new query."
- Just ask, and lead your team with real-time facts.
I've joined `GoogleAds_Keywords` with `Sales_Transactions` using `ClickID`.
| Keyword | Avg Order Value | ROI |
|---|---|---|
| "best gaming monitor" | $450 | +320% |
| "cheap led lights" | $25 | -15% |
Insights: Broad keywords generated traffic, but specific 'long-tail' keywords resulted in 2x higher Average Order Value for the Gen Z demographic.
Simple, Transparent Pricing
Start free. Scale as you grow. No hidden fees. Cancel anytime.
💰 Save 20% with annual billing
FREE
Connect one source and see your first answer.
- 50K rows per data model
- 3 projects
- 5 data sources
- 5 dashboards
- 10 AI generations/month
- Solo Only sub-users
Key Features
- AI Data Modeler
- AI Insights
- Medallion Architecture (Bronze/Silver/Gold layers)
- Marketing Attribution
- Marketing Hub Dashboard
- Campaign Management
- Scheduled Data Refreshes
- 3 Public Dashboard Links
- PNG Export Only
STARTER
Reclaim hours a week and stop stitching spreadsheets.
$29/month
Save $72/year
Billed annually at $276
- 500K rows per data model
- 10 projects
- 15 data sources
- 15 dashboards
- 100 AI generations/month
- Solo Only sub-users
Key Features
- All FREE features
- Multi-layer data pipelines
- CSV/Excel Export
- Advanced Attribution (6 models)
- Email Support (48hr)
- Custom Dashboard Colors
- Real-Time In-App Notifications
- 20 Public Dashboard Links
PROFESSIONAL
Run all 6 attribution models and prove ROI to the CFO.
$129/month
Save $312/year
Billed annually at $1236
- 5M rows per data model
- Unlimited projects
- Unlimited data sources
- Unlimited dashboards
- 500 AI generations/month
- 2-5 sub-users
Key Features
- All STARTER features
- Team Collaboration (2-5 users)
- Compositional data modeling
- Basic RBAC (3 roles)
- Dashboard Embedding
- Custom Dashboard Themes
- API Access (read-only)
- Email Support (24hr)
- Light Branding (logo + colors)
PROFESSIONAL PLUS
Give your whole team self-service reporting at scale.
$399/month
Save $960/year
Billed annually at $3828
- 100M rows per data model
- Unlimited projects
- Unlimited data sources
- Unlimited dashboards
- Unlimited AI generations/month
- 6-100 sub-users
Key Features
- All PROFESSIONAL features
- Enterprise-scale data pipelines
- Full Team Collaboration (6-100 users)
- Advanced RBAC (5 roles, 19 permissions)
- OAuth SSO (Google, LinkedIn)
- Basic Branding (logo + colors)
- API Access (read/write)
- Priority Support (24/7, 4hr SLA)
- Dedicated Account Manager
- Quarterly Business Reviews
- 99.5% Uptime SLA
ENTERPRISE
Custom deployment, onboarding, and support.
- Unlimited rows per data model
- Unlimited projects
- Unlimited data sources
- Unlimited dashboards
- Unlimited AI generations/month
- 100+ sub-users
Key Features
- Unlimited multi-stage data architectures
- All PROFESSIONAL PLUS features
- SAML 2.0 SSO (Okta, Azure AD, OneLogin, ADFS)
- SSO Domain Enforcement (enforce login via IdP)
- Just-in-Time (JIT) User Provisioning
- 99.9% Uptime SLA
- White-Glove Onboarding
- Custom Feature Development
- Direct Engineering Support
- Volume Discounts
- Custom SLA Agreements
Frequently Asked Questions
What is Data Research Analysis?
Data Research Analysis is an AI-powered marketing analytics platform that unifies data from Google Ads, Google Analytics, SQL databases, CSV, Excel, and PDF files. It helps CMOs and marketing executives build custom dashboards and get actionable insights for marketing ROI without requiring technical expertise.
How does Data Research Analysis integrate with Google Ads and Analytics?
Our platform connects directly to your Google Ads and Google Analytics accounts via secure OAuth authentication. Once connected, it automatically imports campaign data, performance metrics, conversion tracking, and audience insights for comprehensive cross-channel analysis.
Can I connect multiple data sources?
Yes! You can connect unlimited data sources including PostgreSQL, MySQL, MariaDB databases, CSV files, Excel spreadsheets, and PDF documents. Our AI-powered data model builder helps you join data across sources for unified reporting.
Do I need technical skills to use Data Research Analysis?
No technical skills required. Our AI Data Modeler uses natural language to help you build data models and dashboards. Simply describe what insights you need, and our AI will generate the appropriate data structures and visualizations.
How is Data Research Analysis different from a general BI tool?
General BI tools visualize data but do not solve the data integration problem. Data Research Analysis is built for marketing executives: it unifies Google Ads, Analytics, SQL, CSV, and PDF sources first, then builds CMO-focused dashboards on top. No complex setup or data engineering required.
Is my data secure?
Yes. All sensitive data including connection credentials and OAuth tokens are encrypted at rest using AES-256 encryption. We follow industry best practices for data security and are compliant with GDPR and international data protection standards.
Can I share dashboards with my team?
Absolutely. You can create projects and invite team members with different permission levels (Owner, Editor, Viewer). Dashboards can also be shared via public links for stakeholder reporting.
How much does Data Research Analysis cost?
We offer 5 plans. FREE is always free (50K rows, 3 projects, 5 data sources, 10 AI generations/month). STARTER is $29/month. PROFESSIONAL is $129/month with unlimited projects, data sources, and dashboards, plus 2-5 team members. PROFESSIONAL PLUS is $399/month for unlimited everything and 6-100 team members. ENTERPRISE is custom pricing tailored to your needs.
Can I upgrade or downgrade my plan?
Yes! Contact our sales team to discuss plan changes. We'll ensure a smooth transition with no data loss. You can also start with the FREE plan to test the platform before committing to a paid tier.
Is there a free trial for paid plans?
We recommend starting with our FREE plan to test the platform with 50K rows, 3 projects, and 10 AI generations per month. For enterprise needs or specific feature testing, contact sales for a customized evaluation.
Do you offer annual discounts?
Yes. Annual billing saves you money on paid tiers. STARTER drops from $29/month to the equivalent of $23/month ($276/year). PROFESSIONAL drops from $129/month to the equivalent of $103/month ($1,236/year), saving $312 annually. PROFESSIONAL PLUS drops from $399/month to the equivalent of $319/month ($3,828/year), saving $960 annually. ENTERPRISE is custom pricing.
What payment methods do you accept?
We're currently in private beta. Contact our sales team to discuss payment options and custom enterprise agreements for your organization.
Official Partnerships & Verifications
Recognised by the World's Leading Platforms
Data Research Analysis is an officially recognised technology provider with Meta and a verified business on LinkedIn, meeting their strict compliance and quality standards.
Technology Provider
Officially listed as a Meta Technology Provider, enabling verified access to the Meta Marketing API.
Verified Business
Recognised as a LinkedIn Verified Business, meeting LinkedIn's verification and compliance standards.
Data Research Analysis is an open source data analysis platform developed under the MIT Open Source License.
Important Links
Pricing Login Privacy Policy Return & Refund Policy Cancellation Policy Terms & ConditionsRegistered With


