
Quick Start Guide
Get Your First Marketing Report in 5 Minutes
Welcome to Data Research Analysis. This guide walks you through connecting your first data source and getting your first report — no SQL, no setup hassle.
Step 1: Connect Google Ads
After logging in, navigate to your project (or create a new project) and click Data Sources in the sidebar.
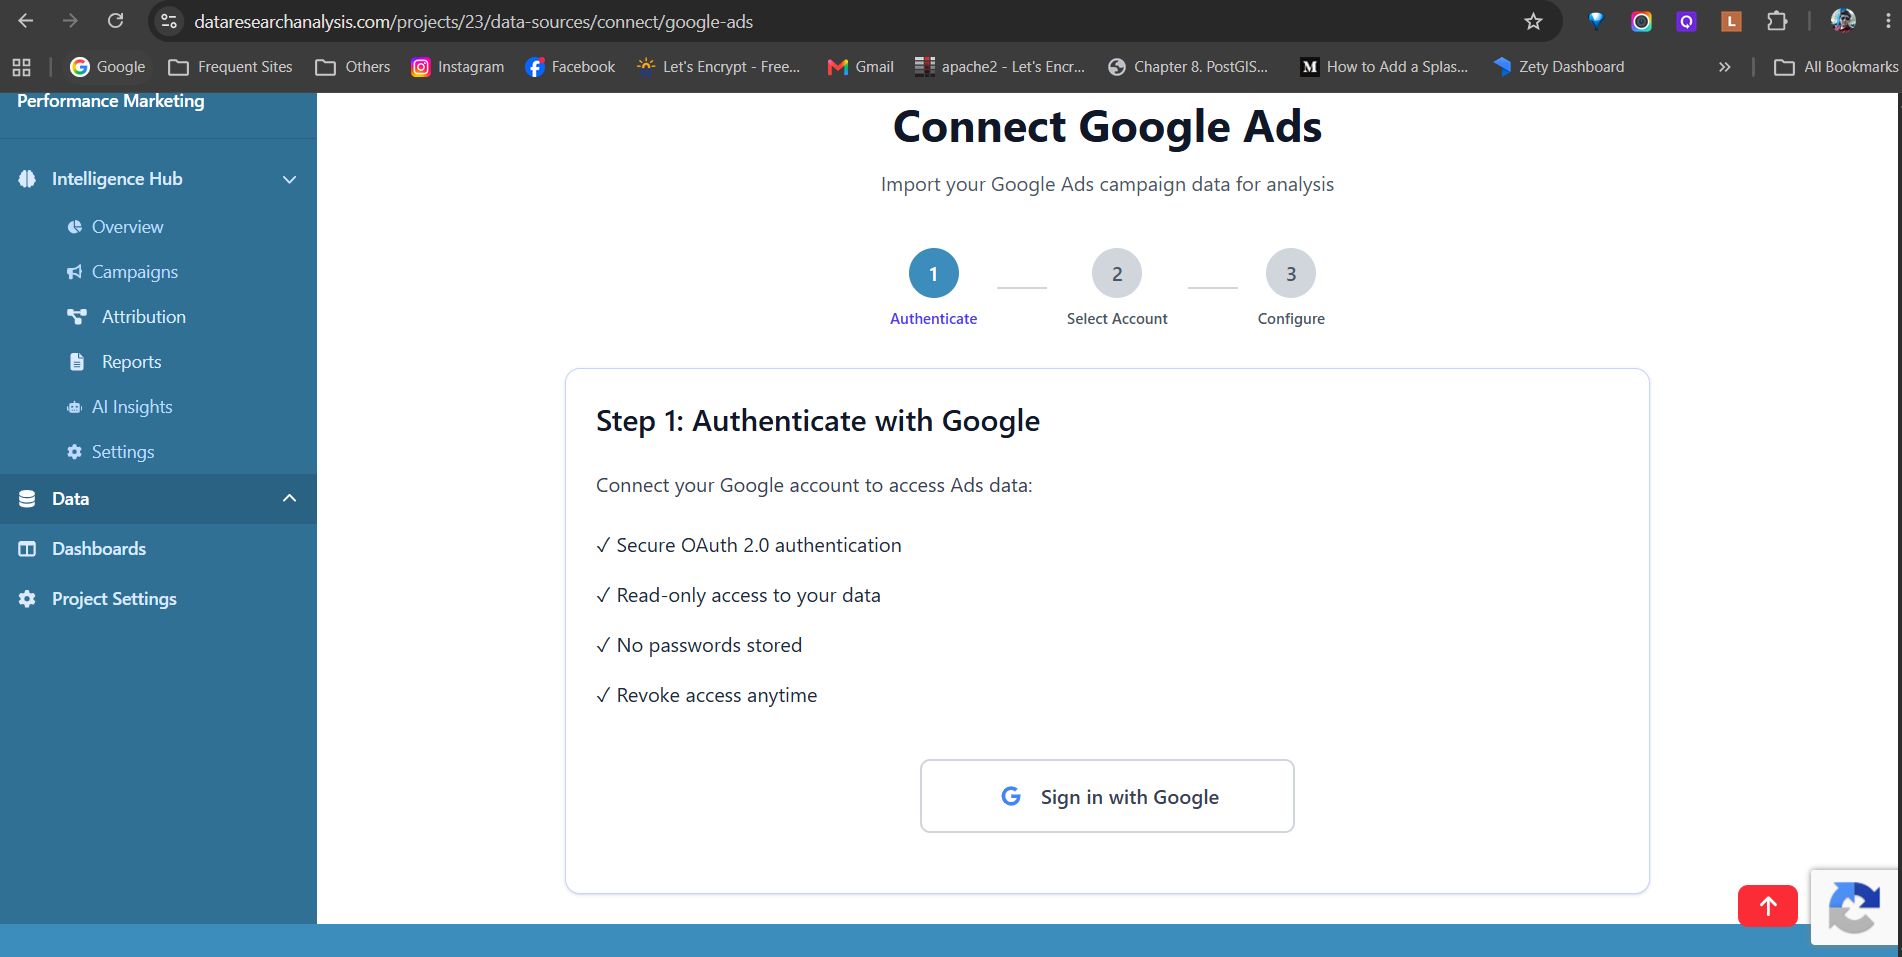
Click Connect Data Source and select Google Ads from the list.
Sign in with your Google account and grant read-only access.
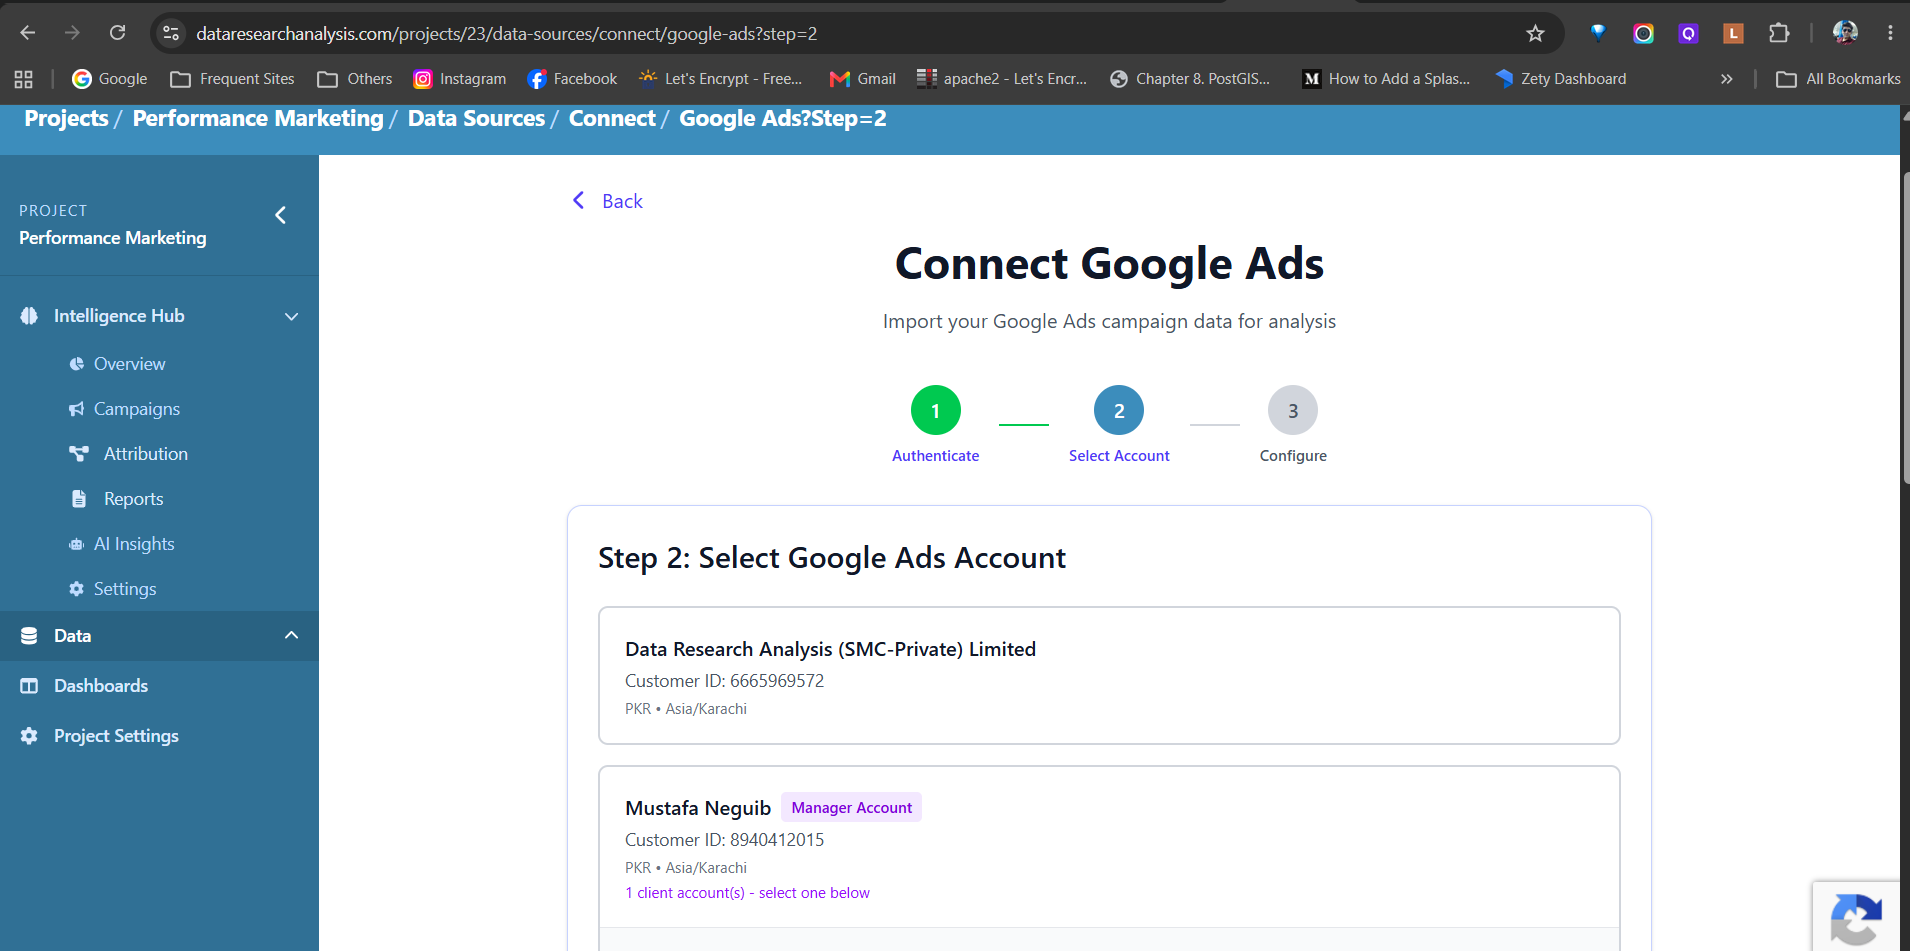
Select the Google Ads account you want to analyze.
Choose your report types (Campaign, Keyword, Geographic, Ad Group, Device) and a date range.
Click Connect. Your data will begin syncing within a few minutes.
You can also connect Google Analytics, Google Ad Manager, MySQL, PostgreSQL, or upload CSV/Excel files.
Step 2: Let AI Build Your First Report
Go to Reports in the sidebar and click Create Report.
Give your report a name (e.g., "Weekly Marketing Performance").
Click Add AI Insights — the system will analyze your connected data and generate summaries, trends, and anomalies automatically.
Add KPI Cards for metrics like Cost, Conversions, ROAS, and CTR.
Add Data Tables to see the raw numbers behind every insight.
Drag sections to reorder them however you like. The report auto-saves as you work.
Step 3: See All Your Metrics in One Place
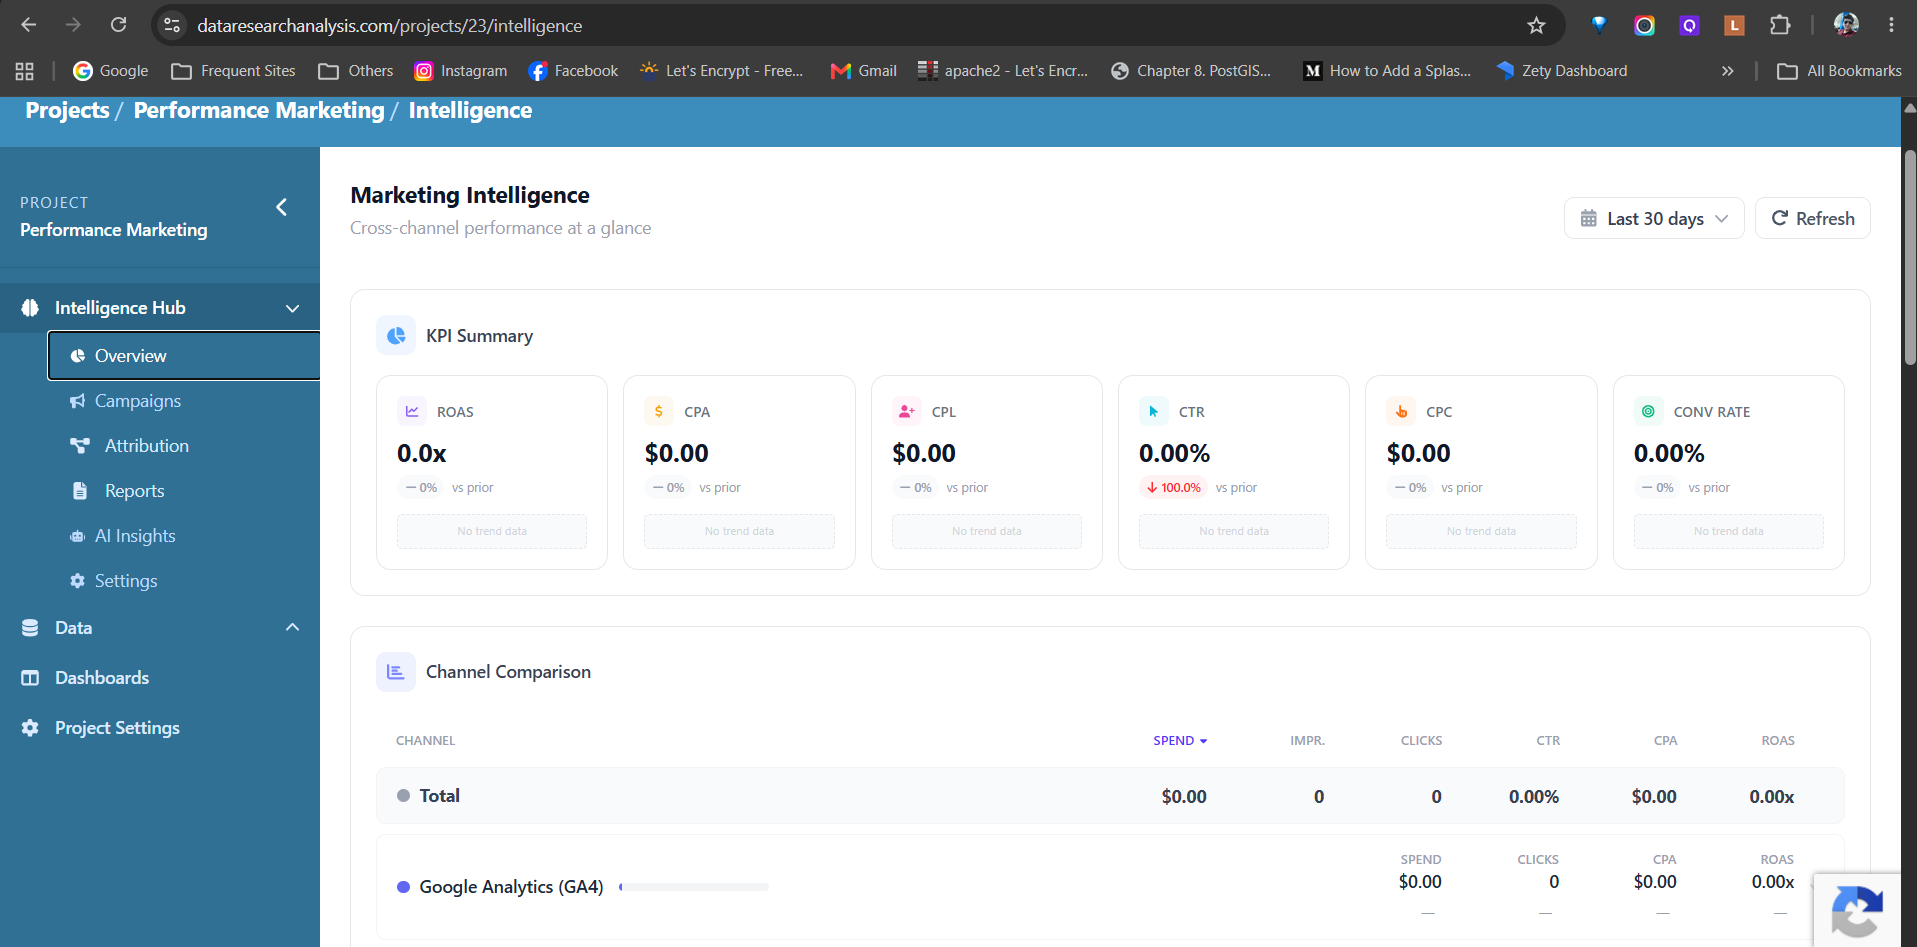
Go to the Intelligence Hub in your project sidebar. This is your command center, organized into several sections:
KPI Summary — At the top, see 6 key metrics at a glance: ROAS, CPA, CPL, CTR, CPC, and Conversion Rate. Each card shows the current value, a percentage change vs the prior period (green for improvement, red for decline), and a sparkline trend chart. Use the date range selector to switch between Last 7 Days, Last 30 Days, Last 90 Days, Month to Date, Year to Date, or a custom range.
Channel Comparison — See every channel (Google Ads, Google Analytics, etc.) side by side in a single table with columns for Spend, Impressions, Clicks, CTR, CPA, and ROAS. Click any column header to sort. Expand any row to see all 9 metrics with period-over-period change badges showing whether each metric is improving or declining.
AI Alerts — The system automatically detects anomalies — unusual spikes or drops in Spend, CTR, CPA, or other metrics — and highlights them with severity levels (Critical, Warning, Info). Each alert shows the expected vs actual value and a suggested action.
Campaign Performance — A searchable, filterable, sortable table of every campaign with Spend, Impressions, Clicks, Conversions, CTR, CPC, CPA, ROAS, Status, and a trend sparkline. Filter by channel or status, sort by any column, and paginate through results. Click any campaign to drill down into its daily trend charts, ad group/keyword/device/geo breakdowns, and AI-powered analysis.
Step 4: Understand Attribution
In the Intelligence Hub, open the Attribution tab to see how your marketing channels work together:
Choose from 5 attribution models: First-Touch, Last-Touch, Linear, Time-Decay, and U-Shaped.
See each channel's share of credit for conversions under each model.
View conversion paths and funnel analysis to understand how users move through your funnel.
Step 5: Let AI Answer Your Questions
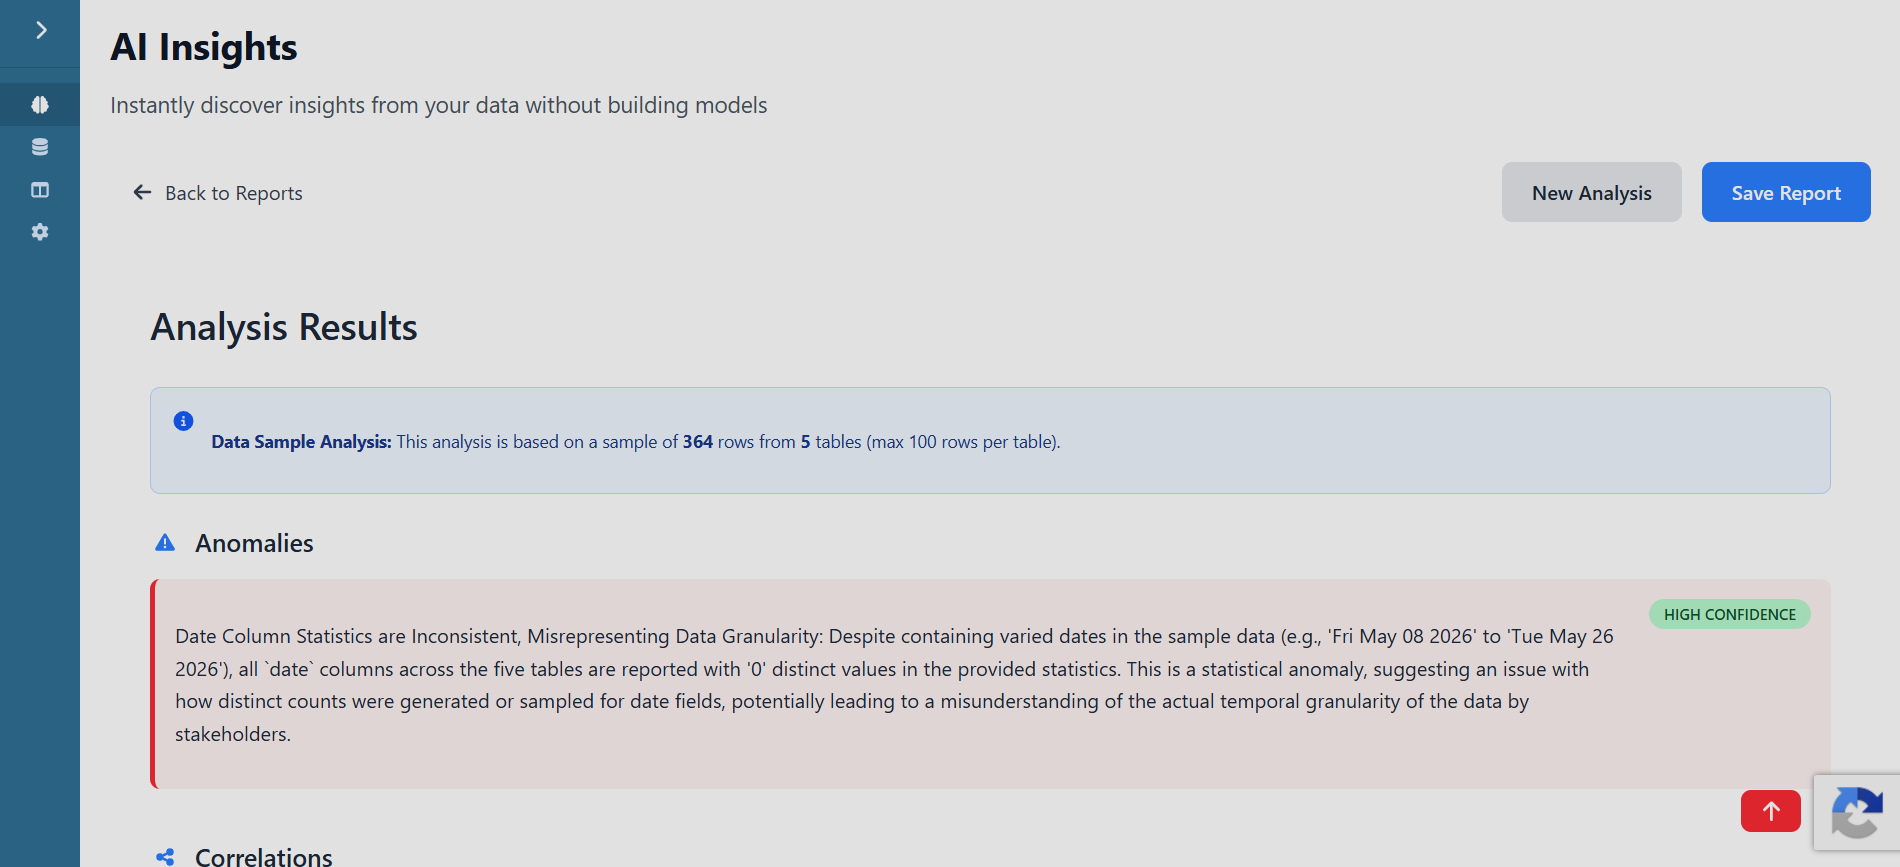
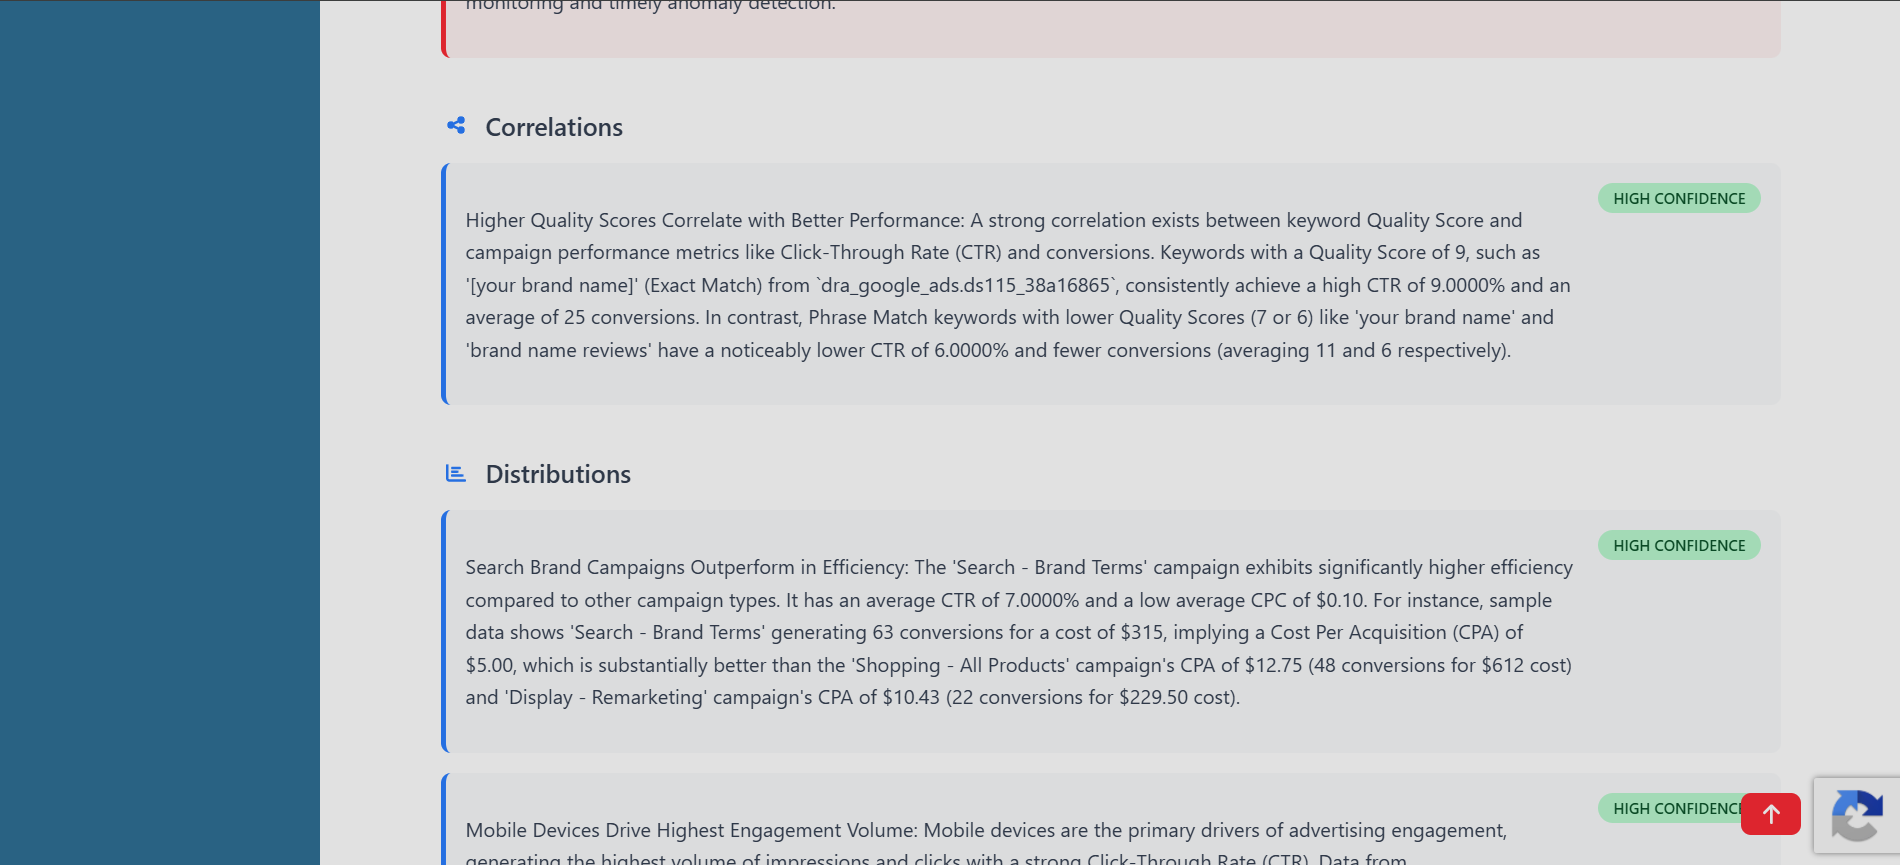
Go to the AI Insights tab in the Intelligence Hub. Select your data sources and generate insights:
The system analyzes your data and organizes findings into Trends, Anomalies, Correlations, Distributions, and Recommendations.
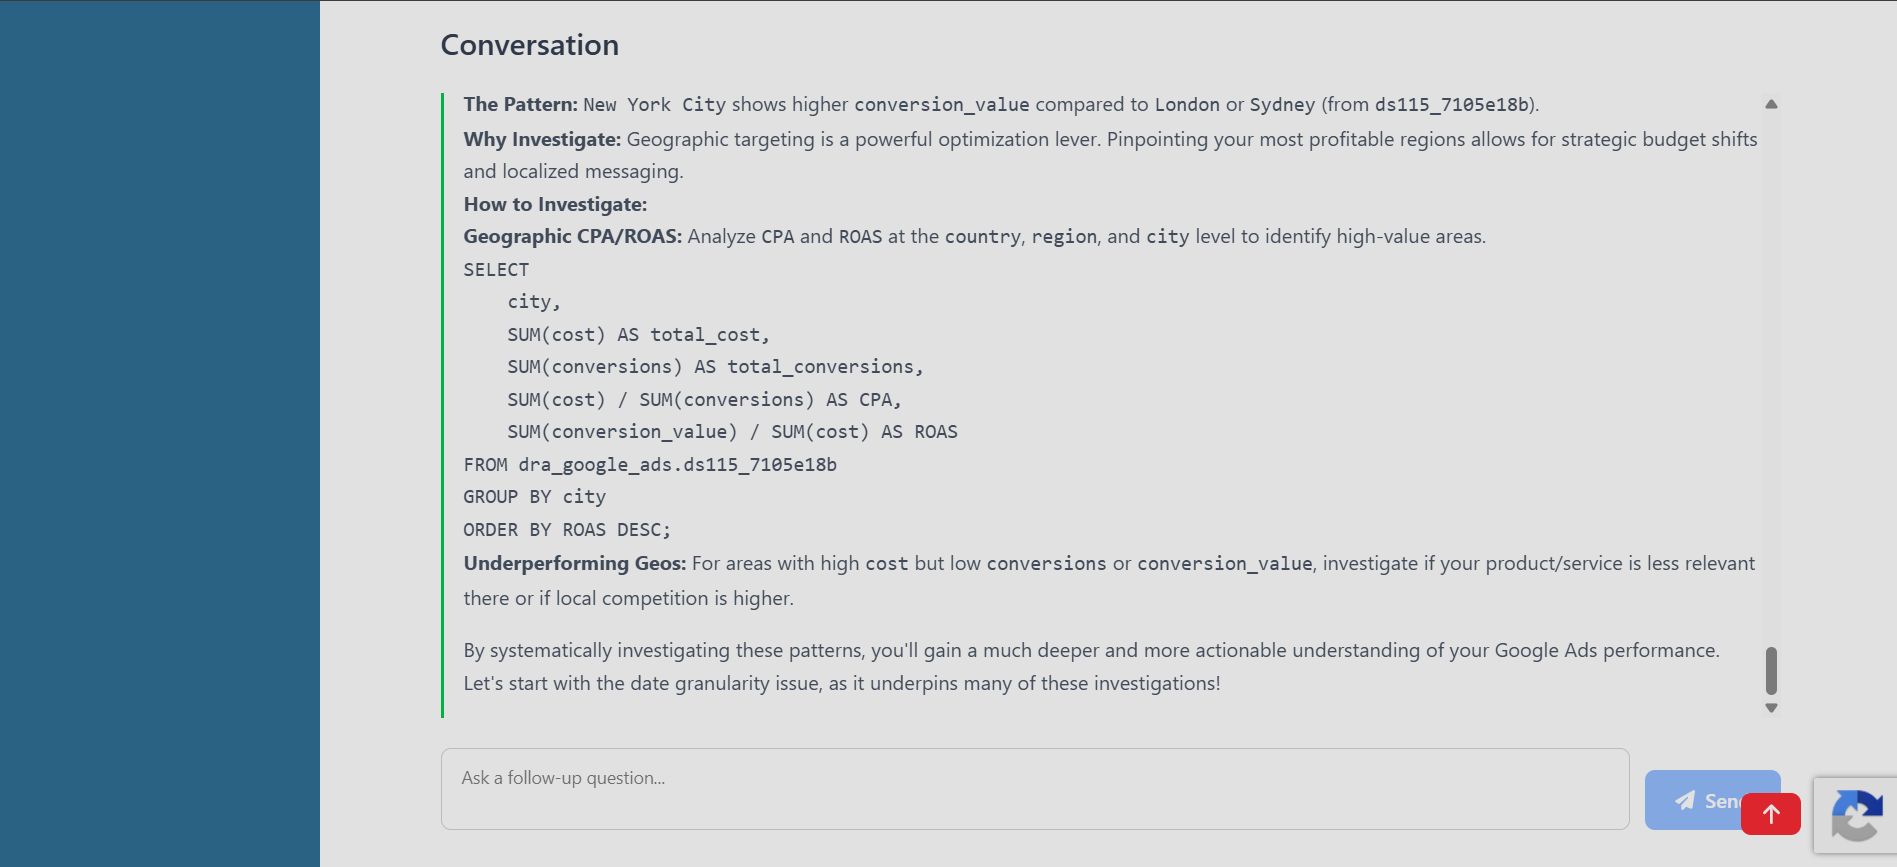
Use the follow-up chat to ask natural language questions like "Which campaign had the highest ROAS last quarter?" or "Show me device breakdown by CPA."
Save important insights and add them directly to dashboards.
Step 6: Optimize Your Budget
In the Intelligence Hub, open the Budget Optimizer (AI-Powered):
Enter your total budget.
Choose your goal: Maximize ROAS, Maximize Conversions, or Minimize CPA.
See a recommended allocation across your channels compared to your current spend.
View the daily pacing chart to track whether you're on target, overspending, or underspending.
Read the AI explanation of the recommendation and any constraints it applied.
Step 7: Share with Your Stakeholders
Open any report and click Share.
Generate a public link with an expiration date.
Send the link to your CFO, CEO, or team. They'll see board-ready reports without needing an account.
You can also export any dashboard or report as PDF or PNG with one click.
Step 8: Set Up Ongoing Syncs
Your data sources will sync automatically on a schedule. To check sync status or trigger a manual refresh:
Go to Data Sources in your project.
Click the sync icon next to any source to refresh immediately.
Review Sync History to see when data was last updated and if any errors occurred.
Need Help?
Email us at hello@dataresearchanalysis.com
Reply to any of our emails — we read them
Welcome aboard. Let's get your marketing data working for you.


