
The Strategic Velocity Gap
Your dashboard is 48 hours old. Your competitor's decision is not.
Decisions in minutes, not days. Capture revenue while competitors are still waiting on a report.
GA4 takes 24 to 48 hours to process data.
Attribution credit can change for up to 12 days after an event is recorded.
More than two-thirds of marketers estimate at least 11% of media budgets are lost to optimization lag.
- Near-real-time sync across every connected source.
- Scheduled refreshes so the number is current when you need it.
The Strategic Velocity Gap
Three ways report lag kills your competitive edge — and how DRA eliminates each one.
48-Hour Blind Spot
Every report you run shows data from two days ago. In those 48 hours, your competitors spotted the trend, reallocated budget, and captured the market. You're always late.
Manual Budget Pivots
Adjusting budget across channels requires exporting, manipulating, and re-uploading spreadsheets. By the time you execute, the opportunity is gone.
Data Staleness Cascade
One stale report leads to another. Decisions compound on bad data. Soon your entire strategy is built on assumptions that were wrong two days ago.
How DRA Delivers Strategic Velocity
Real-time data. Instant pivots. No lag.
Real-Time Data Refresh
Connected data sources update automatically. No manual refreshes, no CSV exports, no 48-hour wait. Your dashboards are always current.
Live KPI Monitoring
Watch spend, conversions, ROAS, and CPL update in real time. Spot anomalies the moment they happen — not two days later.
AI-Powered Alerts
Get notified the instant a metric crosses your threshold. React in minutes instead of days.
AI-Driven Recommendations
Ask "where should I shift budget?" and get real-time answers with data to back them up. No waiting for an analyst.
Unified Cross-Channel View
See Google Ads, Meta, Google Ad Manager, and organic performance in one dashboard. No more toggling between 10 tabs.
Instant Report Sharing
Generate and share CEO-ready reports with a single click. Your stakeholders get current data, not last week's snapshot.
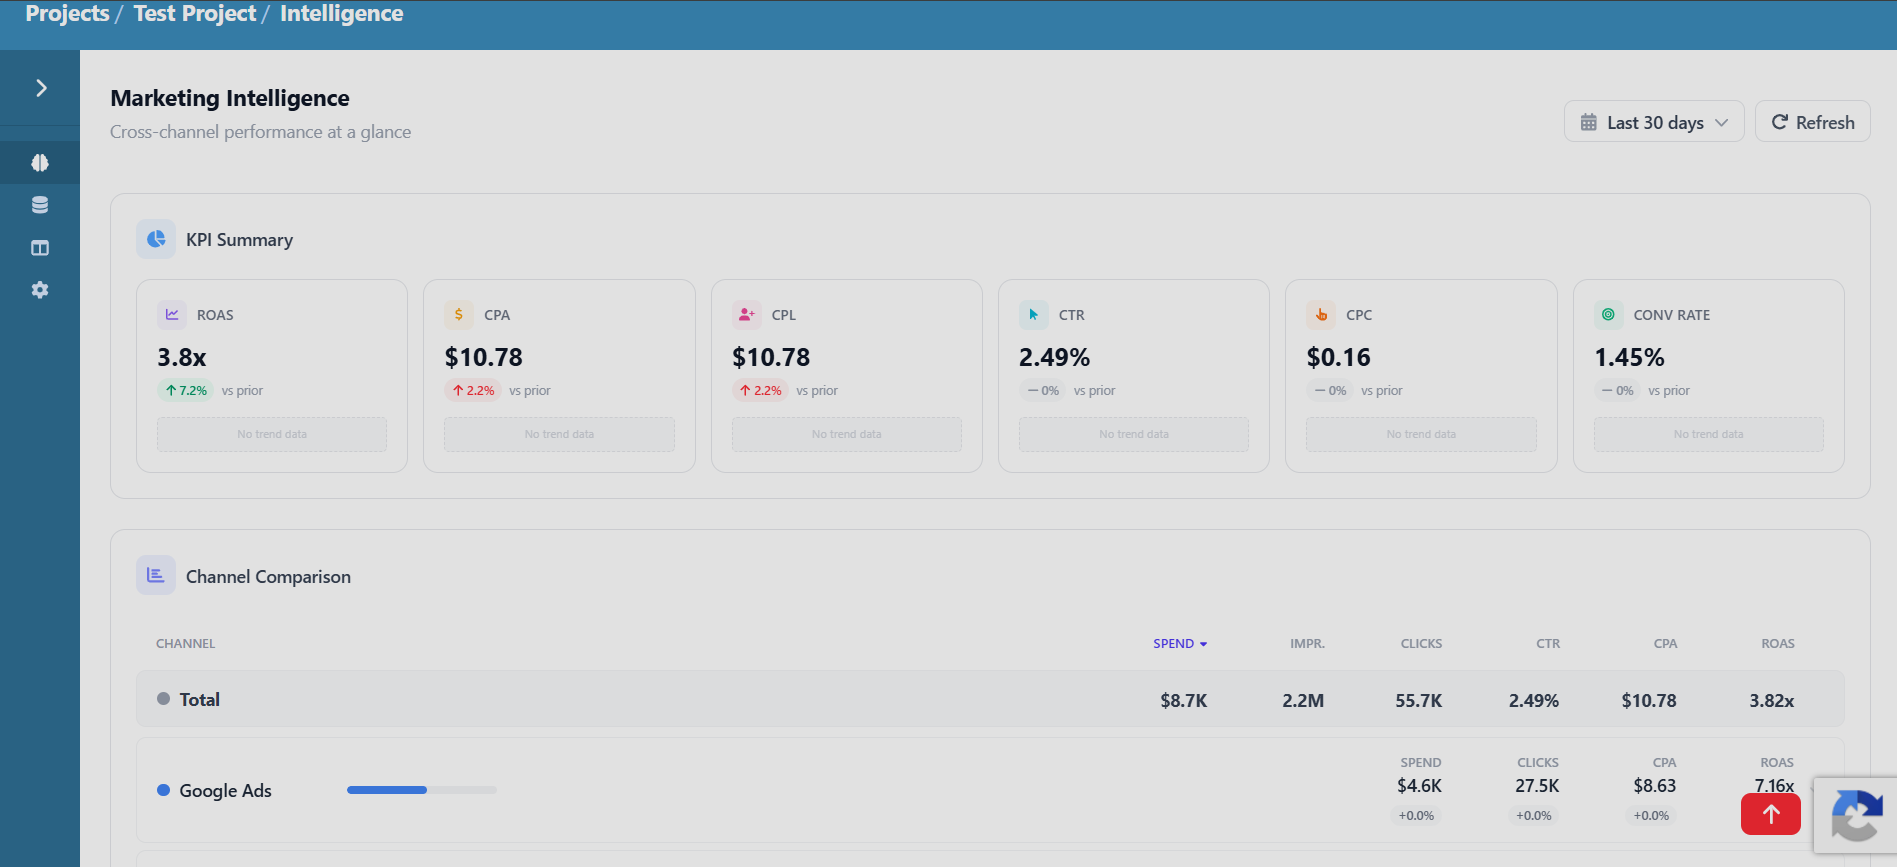
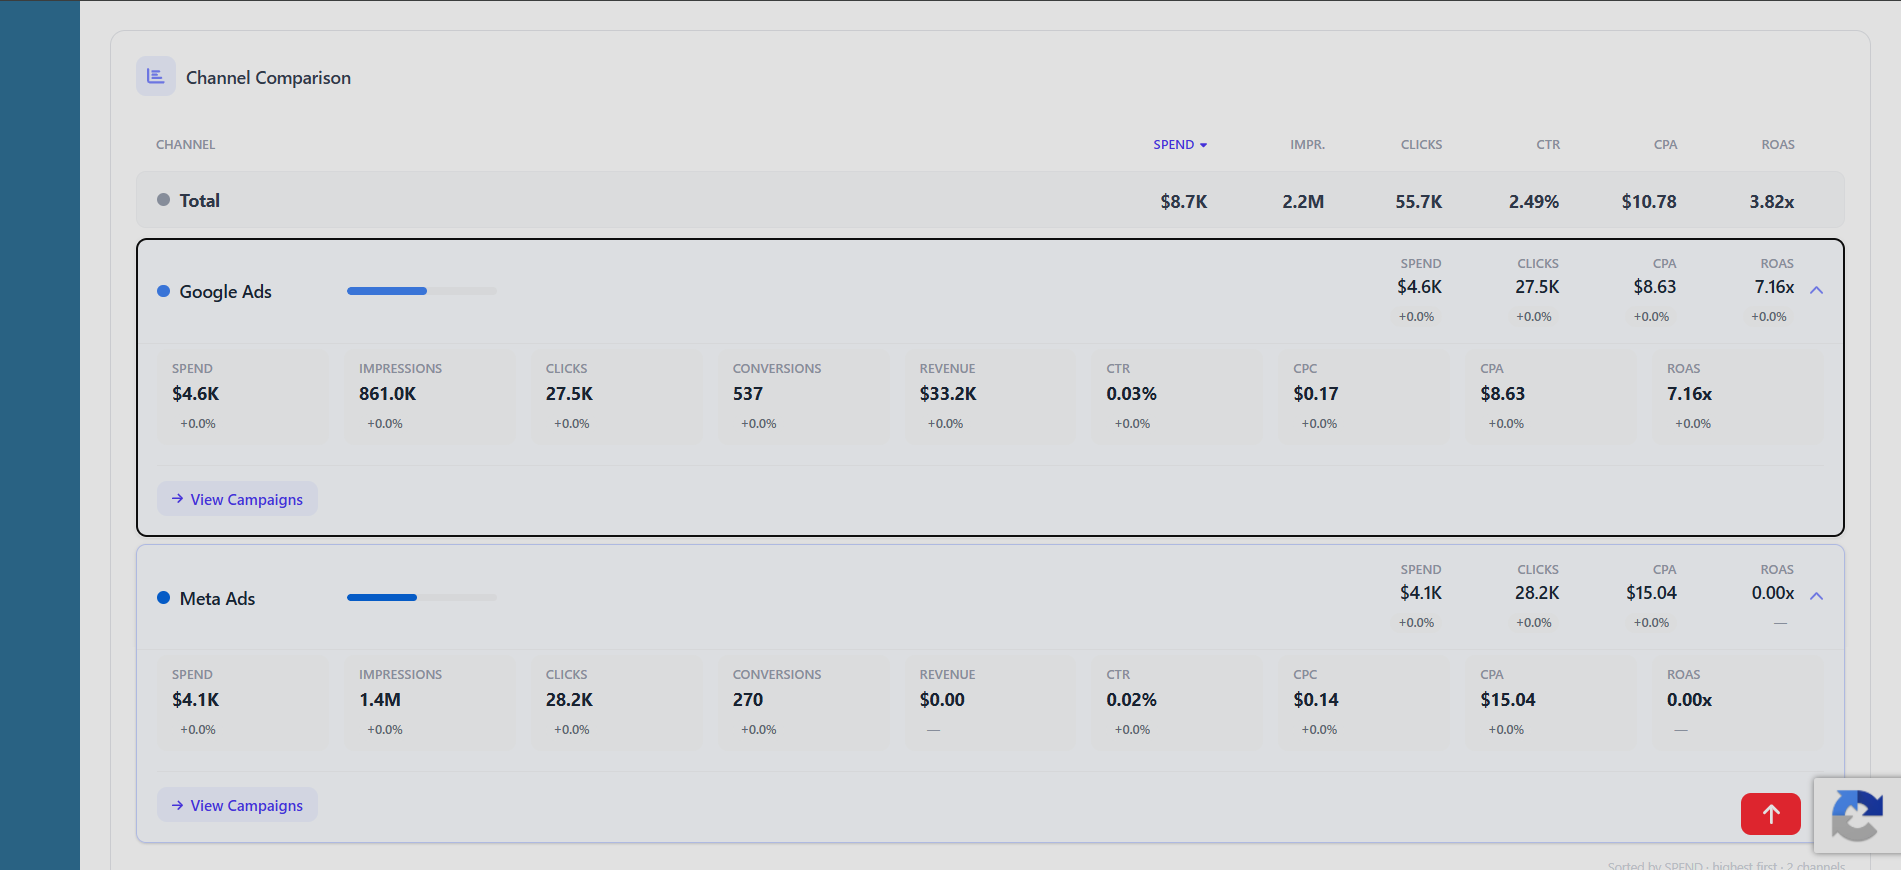
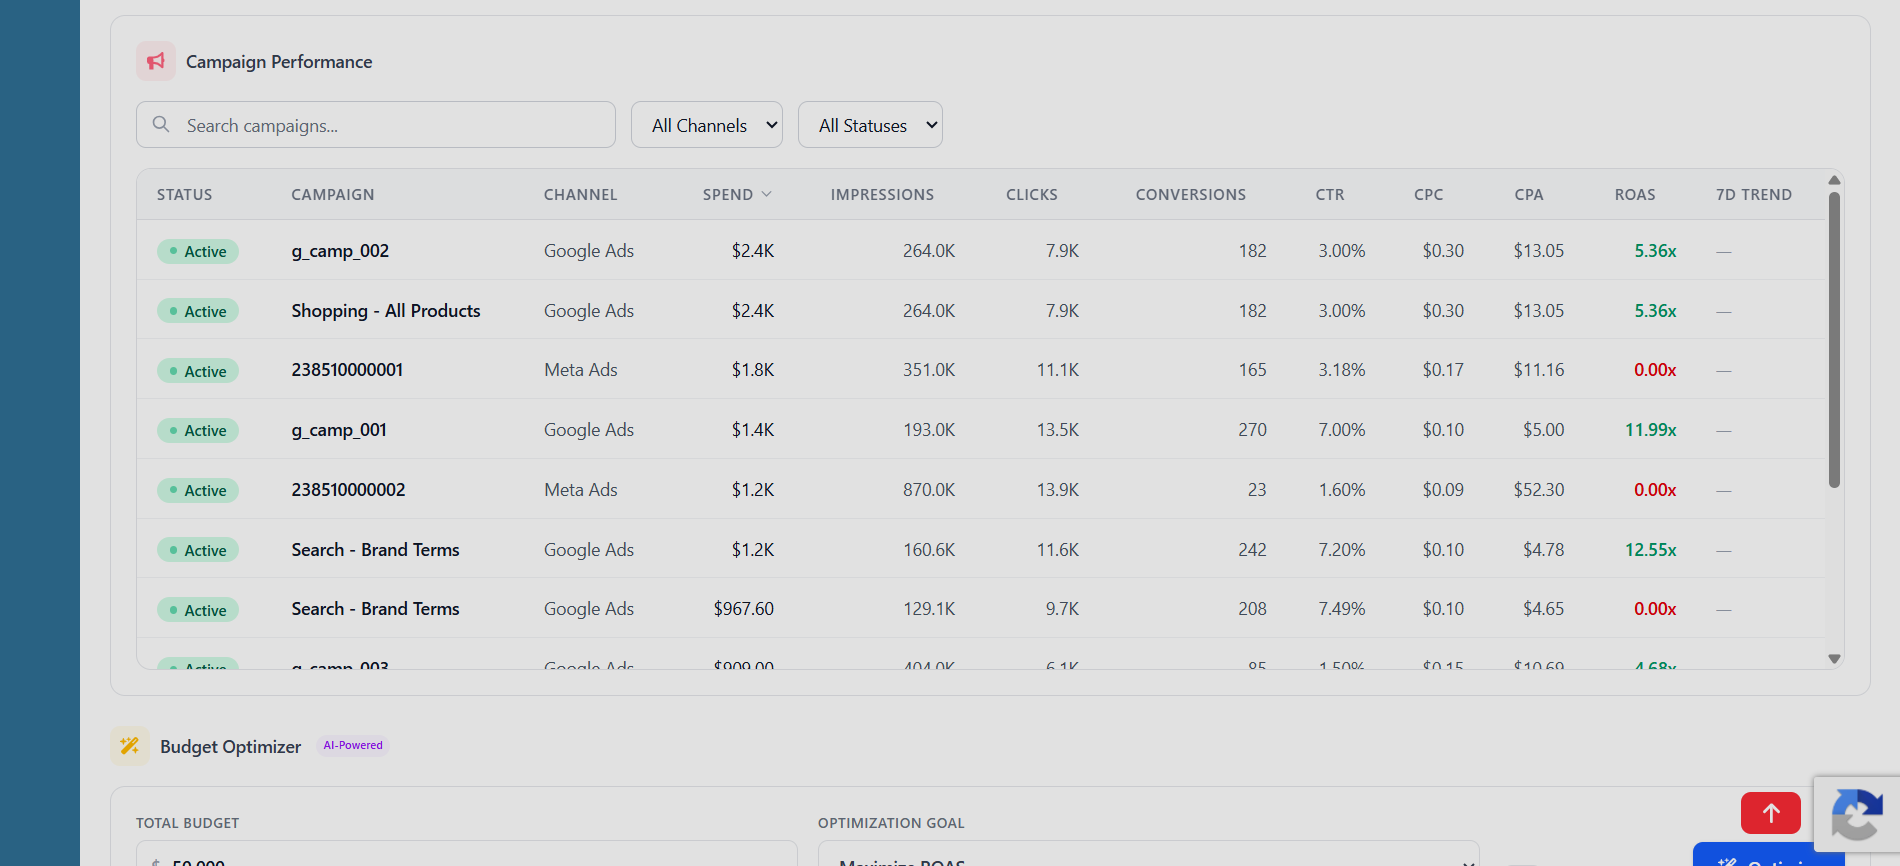
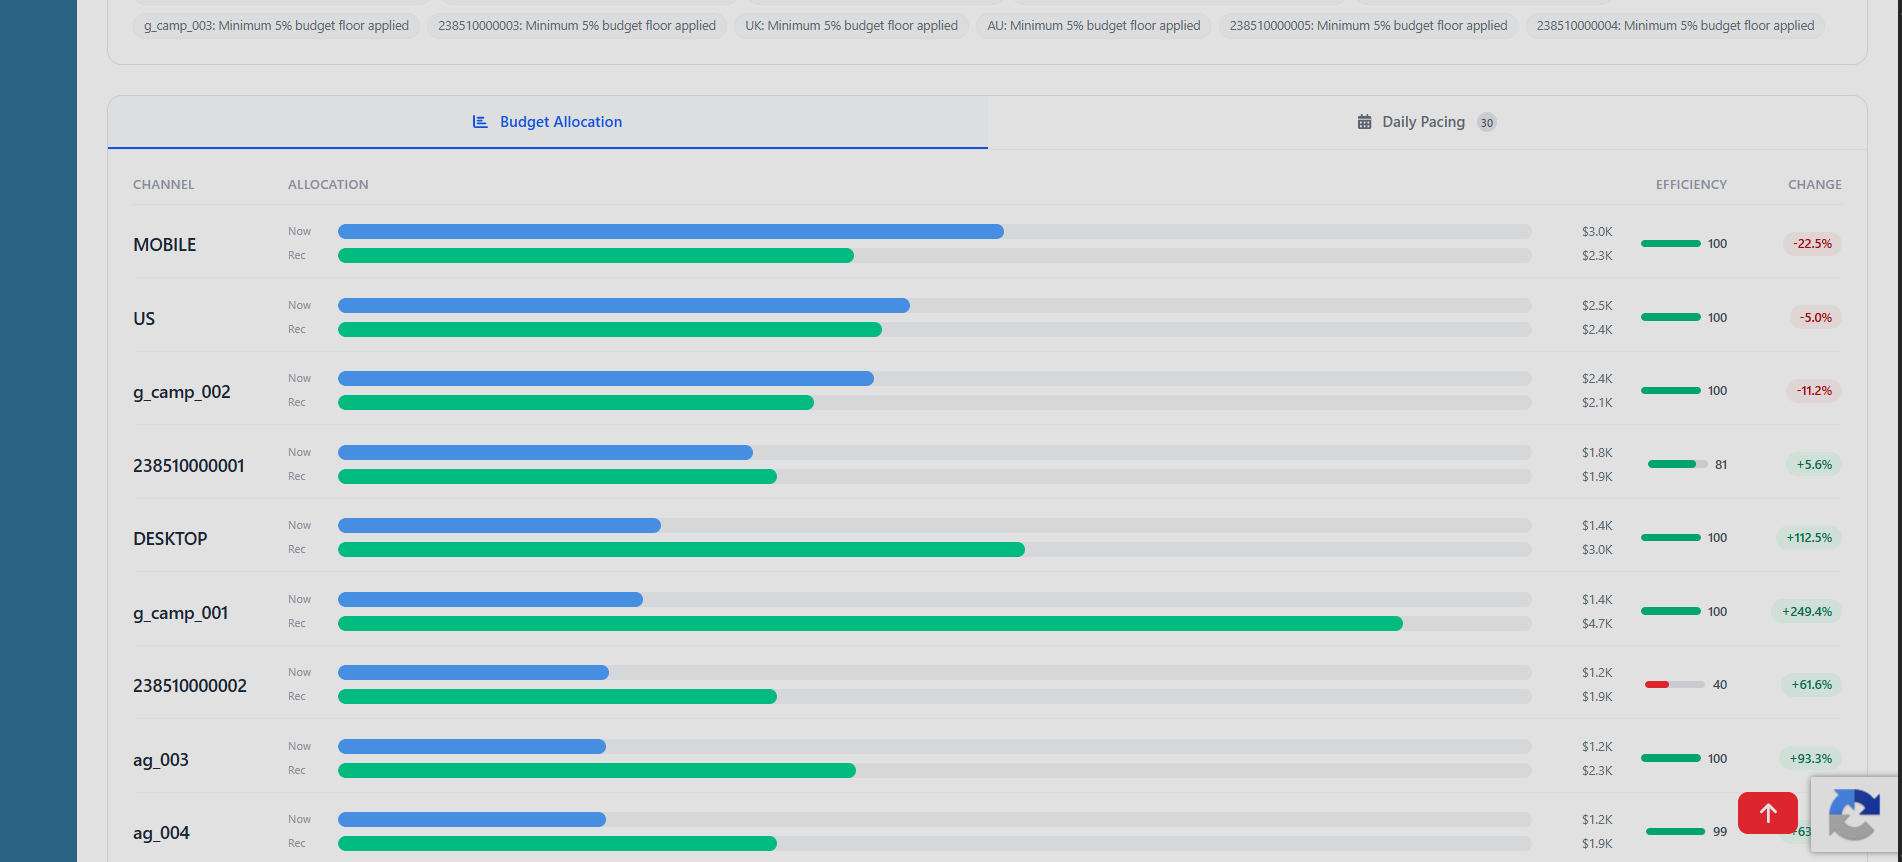
Real-Time Data, Not 48-Hour-Old Reports
DRA connects directly to your data sources and refreshes automatically. Watch spend, conversions, and ROAS update as they happen — and pivot budget the moment a channel underperforms.
- Live KPI cards updated in real time
- AI alerts when metrics cross your thresholds
- No manual refresh — data is always current
Fast Teams Win Markets
GA4 data processing delay you no longer wait on
Attribution credit can keep changing after an event
Of media budgets lost to optimization lag, say two-thirds of marketers
Simple, Transparent Pricing
Start free. Scale as you grow. No hidden fees. Cancel anytime.
💰 Save 20% with annual billing
FREE
Connect one source and see your first answer.
- 50K rows per data model
- 3 projects
- 5 data sources
- 5 dashboards
- 10 AI generations/month
- Solo Only sub-users
Key Features
- AI Data Modeler
- AI Insights
- Medallion Architecture (Bronze/Silver/Gold layers)
- Marketing Attribution
- Marketing Hub Dashboard
- Campaign Management
- Scheduled Data Refreshes
- 3 Public Dashboard Links
- PNG Export Only
STARTER
Reclaim hours a week and stop stitching spreadsheets.
$29/month
Save $72/year
Billed annually at $276
- 500K rows per data model
- 10 projects
- 15 data sources
- 15 dashboards
- 100 AI generations/month
- Solo Only sub-users
Key Features
- All FREE features
- Multi-layer data pipelines
- CSV/Excel Export
- Advanced Attribution (6 models)
- Email Support (48hr)
- Custom Dashboard Colors
- Real-Time In-App Notifications
- 20 Public Dashboard Links
PROFESSIONAL
Run all 6 attribution models and prove ROI to the CFO.
$129/month
Save $312/year
Billed annually at $1236
- 5M rows per data model
- Unlimited projects
- Unlimited data sources
- Unlimited dashboards
- 500 AI generations/month
- 2-5 sub-users
Key Features
- All STARTER features
- Team Collaboration (2-5 users)
- Compositional data modeling
- Basic RBAC (3 roles)
- Dashboard Embedding
- Custom Dashboard Themes
- API Access (read-only)
- Email Support (24hr)
- Light Branding (logo + colors)
PROFESSIONAL PLUS
Give your whole team self-service reporting at scale.
$399/month
Save $960/year
Billed annually at $3828
- 100M rows per data model
- Unlimited projects
- Unlimited data sources
- Unlimited dashboards
- Unlimited AI generations/month
- 6-100 sub-users
Key Features
- All PROFESSIONAL features
- Enterprise-scale data pipelines
- Full Team Collaboration (6-100 users)
- Advanced RBAC (5 roles, 19 permissions)
- OAuth SSO (Google, LinkedIn)
- Basic Branding (logo + colors)
- API Access (read/write)
- Priority Support (24/7, 4hr SLA)
- Dedicated Account Manager
- Quarterly Business Reviews
- 99.5% Uptime SLA
ENTERPRISE
Custom deployment, onboarding, and support.
- Unlimited rows per data model
- Unlimited projects
- Unlimited data sources
- Unlimited dashboards
- Unlimited AI generations/month
- 100+ sub-users
Key Features
- Unlimited multi-stage data architectures
- All PROFESSIONAL PLUS features
- SAML 2.0 SSO (Okta, Azure AD, OneLogin, ADFS)
- SSO Domain Enforcement (enforce login via IdP)
- Just-in-Time (JIT) User Provisioning
- 99.9% Uptime SLA
- White-Glove Onboarding
- Custom Feature Development
- Direct Engineering Support
- Volume Discounts
- Custom SLA Agreements
Frequently Asked Questions
What is strategic velocity in marketing?
Strategic velocity is the speed at which a marketing organization can access data, derive insights, make decisions, and reallocate budget. Most teams operate on a 48-hour lag. DRA delivers real-time data so you can pivot budget the moment a channel underperforms.
How does report lag hurt marketing performance?
When reports take 2-3 days to generate, you are optimizing yesterday's campaigns. In a competitive market, that delay means competitors with real-time data outmaneuver you. DRA eliminates report lag with live-connected dashboards.
Can I get real-time marketing data without a multi-million dollar setup?
Yes. DRA connects your existing data sources in minutes — no engineering team required. Real-time dashboards update as your data changes, giving you strategic velocity without the infrastructure cost.
How fast can I pivot budget with DRA?
Instantly. See which channels are over- or under-performing in real time. Reallocate budget on the fly and see the impact reflected in your dashboards immediately — not 48 hours later.
Official Partnerships & Verifications
Recognised by the World's Leading Platforms
Data Research Analysis is an officially recognised technology provider with Meta and a verified business on LinkedIn, meeting their strict compliance and quality standards.
Technology Provider
Officially listed as a Meta Technology Provider, enabling verified access to the Meta Marketing API.
Verified Business
Recognised as a LinkedIn Verified Business, meeting LinkedIn's verification and compliance standards.
Data Research Analysis is an open source data analysis platform developed under the MIT Open Source License.
Important Links
Pricing Login Privacy Policy Return & Refund Policy Cancellation Policy Terms & ConditionsRegistered With


