
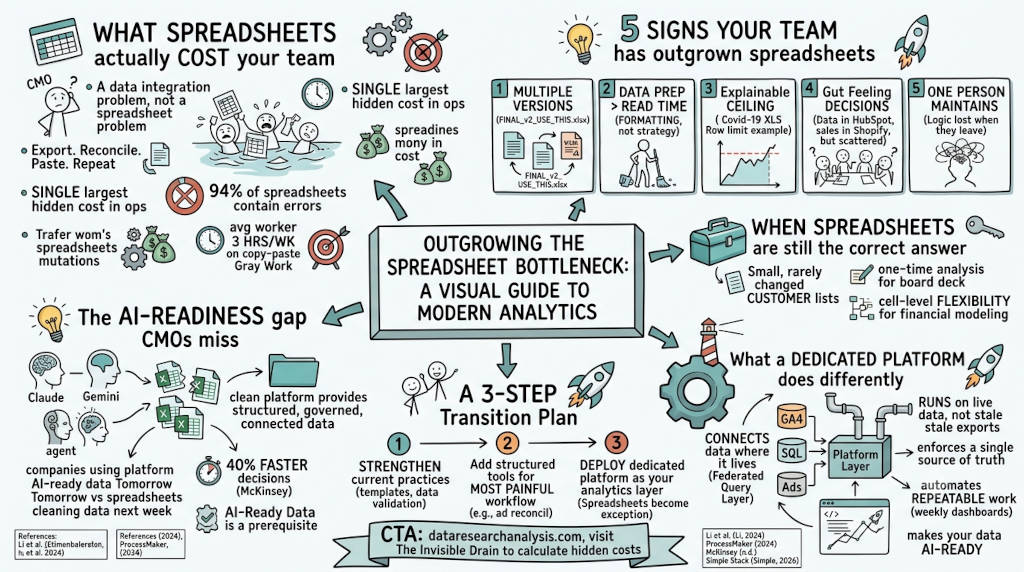
Summary: Spreadsheets are the default analytics tool for most businesses, but they become a liability as data volume and team complexity grow. This article examines the hidden costs of spreadsheet-based analysis — version chaos, manual data prep, silent formula errors, and gut-feel decisions. It provides five diagnostic signs that your team has outgrown spreadsheets, outlines when spreadsheets are still the right choice, and explains what a dedicated data analysis platform does differently. Topics include the AI-readiness argument for structured data, a three-step transition plan, and a FAQ covering cost, setup time, and technical requirements.
Your data is not in your spreadsheets. Your data is scattered across three CRMs, two ad platforms, a data warehouse, and a PDF your vendor emailed last quarter. Spreadsheets were never designed to hold that. You know because you are spending Monday morning reconciling three versions of the same report instead of deciding which campaign to double. That is not a spreadsheet problem. That is a missing data platform problem. And every week you wait, your competitor who already moved is running on live signals while you run on stale exports.
What spreadsheet analytics actually costs your team
Most CMOs do not have a spreadsheet problem. They have a data integration problem that happens to live in a spreadsheet.
The workflow is always the same. Export from GA4. Export from LinkedIn Ads. Export from Salesforce. Paste into Excel. VLOOKUP to match customer IDs. Pivot table. Chart. Email the file. Repeat next week.
This is not analysis. This is data janitor work. And it is the single largest hidden cost in mid-market marketing operations.
The research is clear. A 2024 study found that 94% of spreadsheets contain at least one error (Li et al., 2024). Behavioral data from over 4 million workplace interactions shows the average worker spends three hours weekly in spreadsheets performing more than 1,000 copy-paste actions (ProcessMaker, 2024). That is three hours your marketing team is not analyzing, not optimizing, and not deciding.
Worse, those copy-paste actions are where errors enter. A formula breaks when someone adds a column. A VLOOKUP range shifts when the source sheet changes. A number gets pasted as text. The spreadsheet keeps running. The output looks right. The decision is wrong.
The five signs your team has outgrown spreadsheet analytics
You do not need a platform because spreadsheets are bad. You need one because your operation has crossed the threshold where spreadsheets stop working.
1. You maintain multiple versions of the same data
If your shared drive contains Q3_Report_FINAL.xlsx, Q3_Report_FINAL_v2.xlsx, and Q3_Report_FINAL_USE_THIS.xlsx, you do not have a single source of truth. You have three arguments about which number is right. Finance pulled from one version. Operations pulled from another. Nobody can agree. Decisions get delayed. Trust erodes.
2. Your team spends more time preparing data than reading it
When the process of getting data into a usable shape takes longer than the analysis itself, your team is spending its sharpest hours on formatting. Not on strategy. Not on optimization. Not on growth.
3. You have hit a ceiling you cannot explain
Your spreadsheet used to open in seconds. Now it takes a full minute. Formulas break when you add rows. You cannot connect data from two different tools without manual work. During the COVID-19 pandemic, Public Health England hit Excel's 65,000-row XLS limit and 16,000 positive cases fell off the bottom of the file (BBC News, 2020). Most teams do not reach that threshold. But the pattern is the same. The tool has a ceiling. It does not warn you when you are approaching it.
4. You base decisions on gut feeling despite having data
Your customer data lives in HubSpot. Your sales data lives in Shopify. Your financial data lives in QuickBooks. Seeing the full picture requires someone to spend half a day combining them manually. So you go with your gut instead. You know the revenue number from last month. You do not know why it changed. The context that drives the decision is locked inside the manual merge you did not have time to run.
5. You are the only person who understands the spreadsheet
One person built it. One person maintains it. One person knows how to read it. When that person is sick, on vacation, or leaves the company, the business loses access to its own data. A VLOOKUP chain breaks and nobody remembers why it was built that way. The logic lives in someone's head. The cells just hold the outputs.
When spreadsheets are still the right answer
Spreadsheets are not bad. They are the right tool for a specific range of work.
If your entire customer list fits in a single file and changes rarely, a spreadsheet is fine. If you need a one-time analysis for a board deck and will never run it again, a spreadsheet saves you the overhead of a platform. If you are doing financial modeling that benefits from cell-level flexibility, Excel is still the best tool for that work.
The question is not whether spreadsheets are bad. The question is whether the work you do with them is repeated, collaborative, or time-sensitive. If it is any of the three, you have already outgrown the tool.
What a dedicated data analysis platform does differently
A dedicated platform does not replace your spreadsheet. It replaces the part of your week where you act as a human ETL pipeline.
It connects to your data where it lives
A federated query layer joins GA4, SQL databases, ad platforms, and CSV files without moving the data. You stop exporting and importing. You start asking questions across all your sources at once.
It runs on live data, not stale exports
Your dashboard updates when the source data changes. Not when someone remembers to refresh the pivot table. Not when the finance team sends the updated file. In real time.
It enforces a single source of truth
One definition of "revenue." One definition of "ROAS." One definition of "customer." Every team sees the same number. No more reconciliation meetings.
It automates the work you repeat weekly
Daily sales reports. Weekly campaign dashboards. Monthly channel attribution. A dedicated platform builds them once and refreshes them automatically. Your team stops rebuilding reports and starts acting on them.
It makes your data AI-ready
You cannot train a predictive model on fragmented Excel files spread across departments (QuickLaunch Analytics, 2026). You cannot deploy an AI agent on a workbook with merged cells, color-coded statuses, and a column that is sometimes a date and sometimes a note. A structured data platform is the prerequisite for any AI initiative. The companies that will get real value from AI in 2026 are the ones whose operational data is already governed and connected (Simple Stack, 2026).
The AI-readiness argument most CMOs are missing
This is the gap that is invisible until it becomes urgent.
Every AI tool your team wants to use — Claude, ChatGPT, Gemini, custom ML models — needs structured, governed, connected data to function. Spreadsheet data is none of those things. It is unstructured. It is ungoverned. It is disconnected.
The teams running on spreadsheets today will spend 2027 cleaning data instead of deploying AI. The teams that moved to a dedicated platform today will already be running AI agents on their data tomorrow.
How to make the transition without breaking your operation
You do not need to migrate everything at once. The teams that do this successfully follow a three-step path.
Step 1: Strengthen your current practices
If the signs you recognized were mild, start with templates, data validation rules, and shared storage. This buys you time. It does not fix structural problems.
Step 2: Add structured tools for your most painful workflow
Pick the workflow that causes the most reconciliation overhead. Connect it to a purpose-built analytics tool. Prove the pattern. Then move to the next workflow.
Step 3: Deploy a dedicated platform as your analytics layer
Once three or four workflows are running on structured data, the pattern flips. The platform becomes the default. Spreadsheets become the exception — used for ad hoc analysis, one-off models, and exploratory work. That is the right place for spreadsheets in a modern marketing operation.
FAQ
Q: What if my team is not technical enough for a data platform? A: Modern platforms are built for marketers, not engineers. DRA's AI Data Modeler converts plain English into data models. No SQL required.
Q: How much does a dedicated platform cost for a mid-market team? A: Professional-tier platforms like DRA start at approximately $103/month, well within the budget of a team spending $1,000/month on analytics tooling.
Q: Will I still need my spreadsheets? A: Yes — for ad hoc analysis, one-off modeling, and exploratory work. The platform replaces the recurring manual data integration, not the spreadsheet itself.
Q: How long does it take to set up? A: Most sources connect in one click via OAuth. A first dashboard can go live in under an hour. No IT ticket required.
Q: What happens to my existing data in spreadsheets? A: You can import CSV and Excel files directly. The platform becomes the governed layer on top of everything you already have.
Stop being IT support for your dashboards
The Technical Translation Trap is when CMOs spend their strategic hours debugging SQL queries, refreshing API keys, and troubleshooting broken dashboard connections instead of planning the next quarter. DRA eliminates that overhead with a no-code platform that frees marketing leaders from SQL, API keys, and data pipeline maintenance. One-click integrations. Natural language queries. Self-healing data connections. No code. No tickets. No waiting.
References
BBC News. (2020, October 5). Public Health England: 16,000 COVID-19 cases lost due to Excel limit. https://www.bbc.com/news/technology-54423988
Li, H., Wang, Z., & Zhang, Y. (2024). An empirical study on spreadsheet error rates and their impact on decision making. Frontiers of Computer Science, 18(2), 2384-2396. https://link.springer.com/article/10.1007/s11704-023-2384-6
ProcessMaker. (2024). Repetitive tasks at work: Research and statistics 2024. https://www.processmaker.com/blog/repetitive-tasks-at-work-research-and-statistics-2024/
QuickLaunch Analytics. (2026, February 17). Excel limitations: Why spreadsheets can't scale for enterprise analytics. https://quicklaunchanalytics.com/bi-blog/excel-limitations-enterprise-reporting/
Simple Stack. (2026, April 22). Why spreadsheets are quietly killing your ops (and what to do about it). https://www.simple-stack.com/blog/spreadsheets-killing-enterprise-operations


