
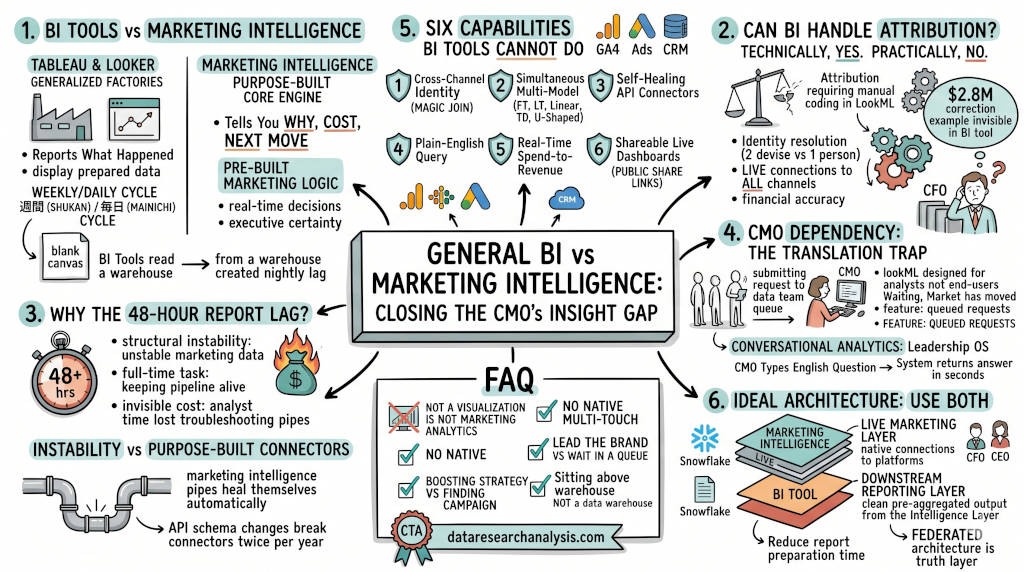
The difference between BI tools (Tableau/Looker) and Marketing Intelligence
DRA Q AND A CONTENT PIECE
Pillar: Pillar 4 — The MarTech Stack Mess / Pillar 2 — The Strategic Velocity Gap / Pillar 5 — The Invisible Drain / Pillar 1 — The ROI Proof Gap / Pillar 6 — The Technical Translation Trap Audience: CMO of a 50 to 200 person company managing 10+ data platforms and a 5 to 20 person marketing team Channel: Blog (SEO) Goal: Open the Prove ROI to CEO money page
Summary: Most CMOs confuse BI tools with marketing intelligence. Tableau and Looker are general-purpose visualization engines. They need a data engineer between you and every question. A Marketing Intelligence platform arrives with attribution models, cross-channel identity resolution, and plain-English querying built in. DRA gives you five attribution models running simultaneously, AI-powered English-to-SQL, and live dashboards you can share without login gates. BI tools tell you what happened. Marketing Intelligence tells you what it cost, who it reached, and what to do next.
Your data team hands you a dashboard two days after the campaign launched. By then, you have already spent $18,000 on a channel your competitor abandoned. Tableau and Looker show you data. They do not tell you where to pull budget. You need a tool built for decisions, not display.
1. What Is the Difference Between a BI Tool and a Marketing Intelligence Platform?
The Answer: A BI tool like Tableau or Looker is a general-purpose visualization engine. It displays data someone else prepared. A Marketing Intelligence platform is purpose-built to collect, connect, and interpret marketing data. One reports on yesterday. The other tells you why something happened, what it cost, and what to do next.
The Cost of Confusing the Two
BI tools serve the whole company. Finance, operations, sales, and HR use the same software. That means no native understanding of attribution windows, campaign hierarchies, cross-channel customer journeys, or spend-to-revenue mapping.
When you open Tableau, you see a blank canvas. To make it useful for marketing, an analyst must write SQL joins, build data models, configure pipeline refreshes, and maintain connectors to every ad platform. That work takes weeks. The maintenance never stops.
Marketing Intelligence platforms arrive with marketing logic already built. Attribution models, channel connectors, and funnel metrics are native. Not custom projects. Not ticket requests.
The cost of confusing the two is not a licensing fee. It is a 48-hour report lag at every decision point your competitor uses to move faster.
2. Is Tableau or Looker Actually a Marketing Analytics Tool?
Tableau: A visualization tool. Connects to many sources. Requires pre-modeled data. No native attribution models, no identity resolution, no marketing logic built in. A drag-and-drop interface on top of a blank warehouse.
Looker: A semantic layer tool. Uses LookML, a SQL-based code language. Defines metrics centrally. Requires 2-3 data engineers to build and maintain models. Powerful for organizations with mature warehouses and 10+ engineers. A barrier for CMOs who need answers today.
Both tools are excellent general-purpose BI platforms. Neither is a Marketing Intelligence platform.
The TCO Reality: What BI Tools Actually Cost Marketing Teams
Competitor 1 (Improvado) published total cost of ownership models for Looker and Tableau across three company sizes. Here is what a 50-person organization actually spends:
Small Team (20 users, 0-1 data engineers):
Looker: $120-167k/year (licensing + 0.5 FTE engineer for LookML + ETL + training)
Tableau: $37-57k/year (licensing + analysts self-serve)
Tableau is 3x cheaper at this size
Mid-Size (50 users, 2-3 data engineers):
Looker: $385-525k/year (licensing + 2 FTE engineers + ETL + training)
Tableau: $153-227k/year (licensing + 0.5 FTE admin + quarterly governance cleanup)
Looker is 2x more expensive, but governance savings start to offset engineering costs
Enterprise (200 users, 8-10 data engineers):
Looker: $1.16-1.86M/year
Tableau: $590-880k/year
Looker cost per user drops as engineering scales. But at 200+ users, Tableau governance failures cost $120-180k/year in analyst reconciliation time.
Source: Improvado TCO models cross-validated with official public pricing. Tableau Standard is $15/Viewer, $42/Explorer, $75/Creator per user/month (Tableau, 2026). Looker pricing estimated at $35k-150k+/year depending on scale — Standard starts ~$60k/year, mid-sized companies report $80k-150k+, large enterprises $1M+ (Google Cloud, 2026). Additional cost data sourced from third-party BI pricing guides (DashboardFox, 2026; Toolradar, 2026; Toucan Toco, 2026).
The 5-Question Marketing Intelligence Diagnostic
Before choosing any tool, answer these five questions:
Question | BI Tool Signal | Marketing Intelligence Signal |
|---|---|---|
Does your CMO open dashboards or submit ticket requests for data? | Ticket requests | Direct access |
Do you need attribution across Meta, Google, LinkedIn simultaneously? | Separate dashboards per channel | One platform, all channels |
Does your reporting carry a 24-48 hour lag? | Yes, warehouse refresh cycle | Real-time or near-real-time |
Do you have 10+ data engineers on staff? | Yes → Looker viable | No engineers needed |
Does your CFO trust your marketing numbers? | Reconciliation meetings scheduled | Financial-grade accuracy, one source |
4-5 BI Tool signals: Looker or Tableau may work if you have the engineering team. 4-5 Marketing Intelligence signals: Your stack is under-serving your leadership.
3. Can Tableau or Looker Handle Multi-Touch Marketing Attribution?
The Answer: Technically, yes. Practically, no. Both can display attribution data if a data engineer builds the model first. Without that infrastructure, neither tool knows what First-Touch, Last-Touch, or U-Shaped attribution means. They are display layers, not attribution engines.
What Multi-Touch Attribution Actually Requires
Five things BI tools do not provide out of the box:
Live connections to every ad channel. Google Ads, Meta Ads, LinkedIn Ads, and GA4 must feed a single model in near-real-time. BI tools require separate connectors, custom ETL pipelines, and scheduled syncs. Each is a failure point.
Cross-channel identity resolution. A user who clicks an ad on Monday and converts Friday via organic on a different device is one customer. BI tools see two unrelated rows. Marketing Intelligence platforms join these identities automatically through Magic Join logic.
Simultaneous multi-model comparison. You need First-Touch, Last-Touch, Linear, Time-Decay, and U-Shaped attribution side by side. A single view hides budget misallocation. BI tools need five separate custom calculations per model.
Financial-grade accuracy. Attribution numbers must match the bank account. BI tools that sample data introduce variance. Columnar storage with full-row processing eliminates it.
Speed. A 48-hour lag in attribution data means every budget decision uses outdated signals.
One company using multi-touch attribution found that channels they had written off were driving their highest-value customers. The correction saved $2.8 million annually (Windsor.ai, 2026). That discovery was invisible in their BI tool.
4. Why Do BI Tools Create That 48-Hour Report Lag?
The Answer: BI tools read from a data warehouse refreshed on a schedule. Most marketing pipelines run nightly. That means every morning report shows yesterday. When a campaign burns budget at noon, the signal arrives the next day. The money is already gone.
The Lag Is a Structural Problem
Marketing teams try to fix lag by scheduling more pipeline runs. This creates a different problem: pipeline maintenance becomes a full-time job.
Every ad platform changes its API at least twice a year. Each change breaks connectors. Each break needs an engineer to diagnose, fix, and test. During that window, data is stale or missing.
The BI tool is not the problem. The architecture underneath it is. BI tools sit on a stable, governed warehouse. Marketing data is not stable. It flows from dozens of platforms, updates continuously, and changes format without warning.
Marketing Intelligence platforms absorb this instability. They maintain the connectors. They handle API changes. The marketing team never sees the pipe break.
The visible cost is the 48-hour lag. The invisible cost is the analyst time spent keeping the pipeline alive instead of finding the next insight. Marketing teams waste an estimated 400 hours per year on manual data maintenance — a figure consistent with industry surveys finding the average marketing team loses 12-20 hours per month on manual reporting (Beastmetrics, 2025).
5. What Can a Marketing Intelligence Platform Do That Tableau and Looker Cannot?
The Answer: Six things that general-purpose BI tools cannot do natively: automatic cross-channel identity resolution, simultaneous multi-model attribution, self-healing API connectors, plain-English query conversion, real-time spend-to-revenue mapping, and shareable live dashboards without login gates. Each capability closes a gap that costs CMOs budget, time, and credibility.
The Six Capabilities
Automatic identity resolution. Joins a user's Google Ads click to their CRM record to their GA4 session automatically. BI tools require an engineer to write explicit SQL join conditions. One missed join means invisible revenue.
Simultaneous multi-model attribution. Runs First-Touch, Last-Touch, Linear, Time-Decay, and U-Shaped attribution side by side. Seeing one model produces false confidence. BI tools require five custom calculations per model, maintained by a data team.
Self-healing channel connectors. Direct connections to Google Ads, Meta Ads, LinkedIn Ads, and GA4. When an API changes, the platform handles it. The dashboard stays live. BI tools break and wait for an engineer.
Plain-English query conversion. Type: "Which campaigns drove revenue last week at the lowest cost per acquisition?" The system converts your question to SQL and answers in seconds. Tableau and Looker require a trained user to build the query manually.
Real-time spend-to-revenue mapping. Tracks spend and attributed revenue in a single, continuously updated model. BI tools display them in separate dashboards that need manual reconciliation.
Shareable live dashboards without login. Present to the board with live data anyone can see without creating an account. Generate a public share link with read-only access. Tableau requires every viewer to have a licensed seat — Viewer at $15/user/month minimum, with enterprise deployments reporting $35/Viewer (Tableau, 2026).
Walk into the boardroom with numbers that reconcile spend to revenue. Prove marketing ROI to your CEO and CFO without a team of analysts behind every slide.
6. When BI Tools Fail Marketing Teams: The CMO's Cost
Every platform has a collapse point. Here is what happens when BI tools are forced to serve marketing organizations:
Looker's Marketing Failure Modes
No data engineers = 6-month paralysis. A 30-person marketing team buys Looker. No one knows SQL or Git. LookML training takes 3-6 months. Analysts can only view pre-built dashboards. Ad-hoc requests pile up in tickets with 2-3 week turnarounds. CMO considers switching by month 9.
Multi-cloud latency spiral. Enterprise runs Snowflake on AWS, Salesforce in Heroku, and Google Analytics in BigQuery. Looker queries crawl across clouds. Dashboards with cross-cloud joins take 45-90 seconds. Team builds extract pipelines, duplicating data and adding 12-24 hour lag.
Visual polish limits. CMO needs board-ready animations, custom fonts, and interactive tooltips. Looker cannot deliver. Team exports static PNGs and recreates designs in Figma. Live dashboards become manual exports.
Tableau's Marketing Failure Modes
100+ users with no governance = metric chaos. Ten regional teams build workbooks independently. After 18 months, "conversion rate" has 14 different calculations across 87 dashboards. CFO's quarterly review shows marketing ROI 30% higher than finance's calculation. Investigation burns 200 analyst hours. Trust disappears.
Real-time campaign failure. Performance team needs live spend tracking for $2M/day ad budget. Tableau extract refreshes run hourly at best. In that window, campaigns overspend by $83k before alerts fire. Live connection requests timeout on 50M-row tables (Tableau Help, 2026).
Embedded analytics cost. B2B SaaS embeds Tableau dashboards for customer reporting. Customers see "Powered by Tableau." Custom domain masking requires Tableau Server, with infrastructure costs typically adding $15k-50k/year. OEM embedded deals start at $60k-150k in year-one fees (Usedatabrain, 2026). API rate limits block 200+ concurrent customer sessions.
7. What Is the Right Architecture: BI Tool, Marketing Intelligence, or Both?
The Answer: They serve different functions. Use a Marketing Intelligence platform as the live marketing layer. Use a BI tool downstream for cross-functional reporting. The MIS handles the complexity. The BI tool handles the visibility. Neither does a job it was not designed for.
The Federated Architecture
The mistake most companies make is expecting a BI tool to replace Marketing Intelligence. That forces analysts to rebuild marketing logic a purpose-built platform would provide natively. The result is a permanent maintenance burden with inferior output.
The correct approach: The Marketing Intelligence platform maintains live connections to all marketing sources, resolves attribution, and serves as the single source of truth for marketing performance. The BI tool connects to clean, pre-aggregated output from the Marketing Intelligence layer for finance, operations, and executive reporting.
This gives your CMO a live view with full attribution and your CFO a clean cross-functional view without navigating a marketing tool.
Migration Budget: What Switching Costs
If your team already bought Looker or Tableau, migrating to Marketing Intelligence has real costs. Based on Improvado's published migration estimates cross-validated with DRA's implementation data:
Tableau → Marketing Intelligence: 4-8 weeks for data migration and dashboard rebuild. $40-80k in analyst time. The existing Tableau license can be retained for board presentations during the transition.
Looker → Marketing Intelligence: 8-12 weeks if LookML models must be translated. $60-120k in engineering time. The biggest time savings come from not needing to rebuild SQL logic — Marketing Intelligence platforms arrive with attribution and connectors pre-built.
Recommended approach: Run both in parallel for 1-2 quarters. Use Marketing Intelligence for daily operations. Keep the BI tool for cross-functional reporting during the transition. Sunset the BI tool's marketing dashboards once attribution parity is achieved.
8. How Does DRA Close the Gap Between BI Tools and Marketing Intelligence?
The Answer: DRA is a Federated Marketing Intelligence OS. It gives you five attribution models running simultaneously, an AI Data Modeler that converts English to SQL, and live dashboards you can share without login. No LookML. No SQL. No engineer between your question and your answer.
Built for the CMO, Not the Data Team
DRA's AI Data Modeler, powered by Gemini 2.0, auto-infers relationships across your data sources. When you type "Which campaign drove the highest customer lifetime value last quarter?" the system maps the query across your Google Ads, CRM, and GA4 data without manual joins. It shows you the generated SQL so you can verify the logic. Total time: seconds. No ticket. No analyst. No delay.
Five simultaneous attribution models. First-Touch, Last-Touch, Linear, Time-Decay, and U-Shaped. Run all five at once. See where budget is misallocated across every model, not just one.
The Federated Query Layer joins data where it lives. No extracting and duplicating data to a centralized warehouse before you can ask a question.
Public Share Links give the board live data without creating accounts. Tableau charges per viewer license. DRA generates read-only share URLs in one click.
Connectors auto-heal when APIs change. DRA maintains 500+ platform connections. When Google Ads changes its API schema, DRA absorbs the update. Your marketing team never sees the break.
What a CMO Actually Sees
You type: "Show me which channels underperformed last week and how much we should shift in budget." DRA maps your question to live data, runs five attribution models, and returns an answer with dollar figures. No analyst queue. No 48-hour lag. No SQL.
That is the differentiator. Your competition is still waiting for a ticket to clear. You have already made the decision and started the next campaign.
FAQ
Q: Is Tableau a marketing analytics tool? A: No. Tableau is a data visualization tool. It can display marketing data but does not natively support attribution models, multi-channel identity resolution, or real-time ad platform connections. Marketing use requires significant custom engineering.
Q: Does Looker support multi-touch attribution? A: Only if a data engineer builds the model in LookML first. This is not a native feature. It requires custom SQL logic for each attribution model, separate connections to each ad platform, and ongoing maintenance as APIs change.
Q: Can I keep using Tableau for board presentations while using DRA for daily operations? A: Yes. This is the recommended architecture. Use DRA as the live marketing intelligence layer. Connect Tableau to DRA's clean, pre-aggregated output for cross-functional executive reporting. Neither tool does a job it was not designed for.
Q: How much does a Marketing Intelligence platform cost compared to Tableau or Looker? A: DRA offers tiered plans: Free ($0), Starter ($29/mo), Professional ($129/mo), Professional Plus ($399/mo). Compare to Tableau at $15-$115/user/month (Tableau, 2026) or Looker at $40k-150k+/year (Google Cloud, 2026). DRA eliminates the engineering overhead both BI tools require for marketing use.
Q: Will I lose my existing Looker or Tableau dashboards if I switch? A: No. You can run both in parallel during a 1-2 quarter transition. Use DRA for daily operations while maintaining existing BI dashboards for cross-functional reporting. Sunset the BI tool's marketing dashboards once you reach attribution parity.
Q: How long does implementation take? A: DRA's platform connects to your marketing data sources in hours, not weeks. No LookML to build. No pipelines to configure. No engineering queue. Your first attribution report runs in under 15 minutes after setup.
Q: How do I prove the ROI of switching from BI tools to Marketing Intelligence? A: Track three numbers: (1) analyst hours reclaimed from dashboard maintenance, (2) attribution corrections that find misallocated budget, and (3) campaign decisions made on live data vs. 48-hour lag. The average marketing team recovers 400 hours of manual data work annually.
Q: What makes a platform a true Marketing Intelligence platform? A: Native connectors to all major ad and analytics platforms, automatic cross-channel identity resolution, built-in multi-touch attribution models, AI-powered natural language querying, real-time or near-real-time data processing, and shareable outputs that require no technical expertise to read or present.
CTA
Your BI tool reports yesterday. DRA tells you what to do today. Walk into your next board meeting with marketing ROI the CEO and CFO will believe.
References
Tableau. (2026). Tableau pricing for data people. Salesforce. Retrieved July 1, 2026, from https://www.tableau.com/pricing
Google Cloud. (2026). Looker pricing. Alphabet. Retrieved July 1, 2026, from https://cloud.google.com/looker/pricing
DashboardFox. (2026). Tableau pricing explained — Creator, Explorer, Viewer. DashboardFox Guides. https://dashboardfox.com/guides/bi-software-pricing-guide/tableau-pricing-explained/
Toucan Toco. (2026). Looker pricing: How much does Looker really cost in 2026? Toucan Toco Blog. https://www.toucantoco.com/en/blog/looker-pricing
Usedatabrain. (2026). Tableau embedded analytics pricing: Plans, costs, and trade-offs. https://www.usedatabrain.com/blog/tableau-embedded-analytics-pricing
Windsor.ai. (2026). Customer reviews. Windsor.ai. https://windsor.ai
Tableau Help. (2026). Schedule refreshes on Tableau Cloud. Salesforce. https://help.tableau.com/current/online/en-us/schedule_add.htm
Google Cloud. (2026). Introduction to LookML. Alphabet. https://cloud.google.com/looker/docs/what-is-lookml
Beastmetrics. (2025). Marketing analytics reporting: Stop wasting 15 hours on manual reports. https://beastmetrics.io/blog/how-to-save-hours-on-marketing-reports/
HubSpot. (2026). 2026 state of marketing report. https://www.hubspot.com/state-of-marketing
HubSpot. (2026). 2026 marketing statistics, trends, & data. https://www.hubspot.com/marketing-statistics
Google Cloud. (2022, April 7). Bringing together the best of both sides of BI with Looker and Data Studio. Google Cloud Blog. https://cloud.google.com/blog/products/data-analytics/looker-and-data-studio-integrate-for-best-of-both-worlds
Tableau Community. (2026). Tableau forums. Salesforce. https://community.tableau.com/s/explore-forums
Google Cloud. (2026). Looker documentation. Alphabet. https://cloud.google.com/looker/docs
Toolradar. (2026). Tableau pricing 2026: Plans, hidden costs & cheaper alternatives. https://toolradar.com/tools/tableau/pricing


