
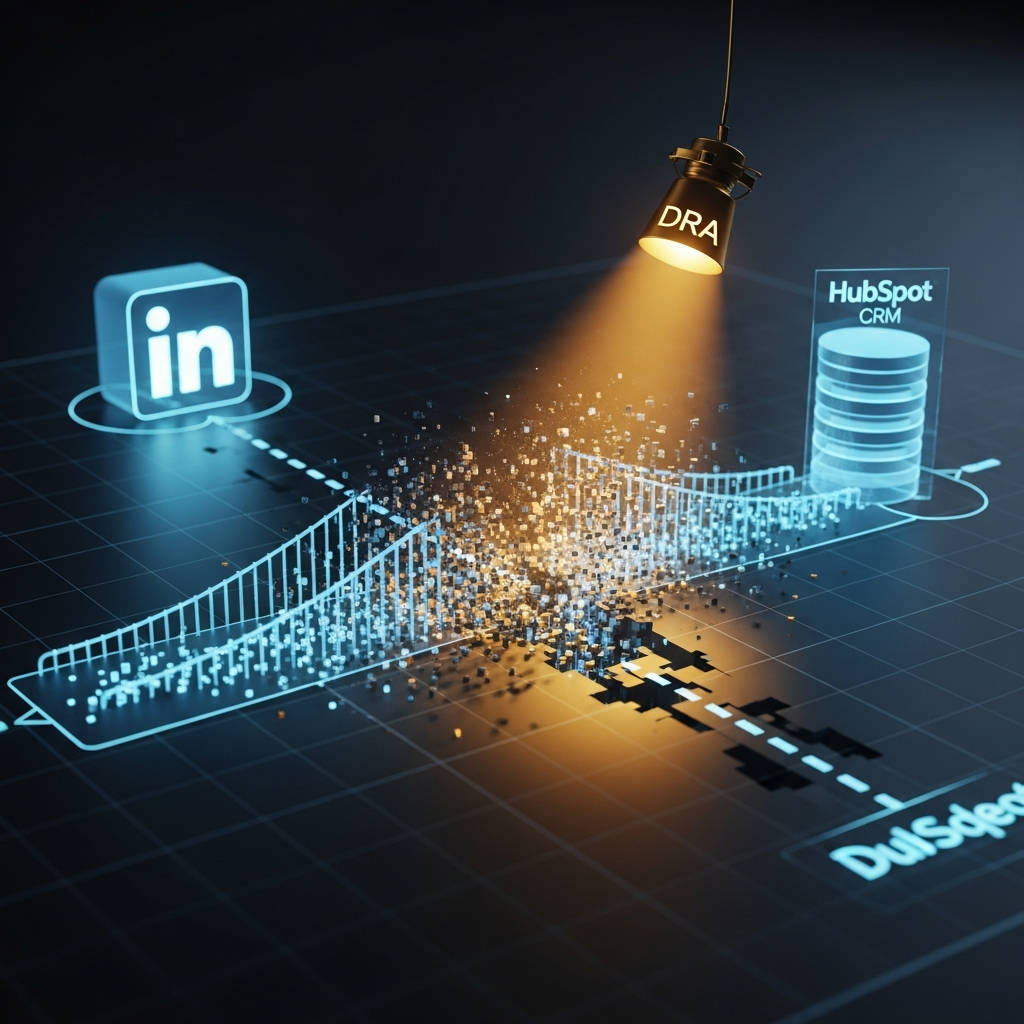
Summary: B2B Signal Loss is the gap between leads reported in LinkedIn Ads and records appearing in your CRM. It is caused by fragmented attribution silos, privacy restrictions, and manual data handling. This gap costs CMOs board-level trust — one-third of marketing leaders say proving ROI is their hardest challenge (HubSpot, 2026). The fix requires a unified truth layer that connects ad platforms directly to CRM pipeline data, enabling automated sync, multi-model attribution, and real-time anomaly detection. Without it, ad algorithms optimize toward form fills instead of closed revenue.
Your LinkedIn Ads dashboard says 500 leads. Your CRM says 320. The CEO wants to know why the numbers don't match. This gap — B2B Signal Loss — is the single biggest reason CMOs cannot prove the ROI of their largest paid channel. It is not a tracking pixel problem. It is an infrastructure problem. Every month without a fix, your ad algorithms optimize toward the wrong signal and your budget follows.
1. What is B2B Signal Loss?
The Answer: B2B Signal Loss is the failure to connect a LinkedIn ad interaction to its corresponding CRM record. The ad platform counts a conversion. The CRM never sees the lead. The gap between these two numbers is signal loss.
Three failures create this gap.
The Attribution Gap. LinkedIn sees a click. HubSpot or Salesforce sees a "Direct" visit. Neither system shares data with the other. The lead exists in both places but no link connects them.
The Privacy Wall. iOS 14 and browser cookie restrictions blind the tracker before the lead form submits. LinkedIn fires an event. The CRM never receives it.
The Data Drudgery. Your team exports CSVs from LinkedIn and imports them to HubSpot manually. Human error and processing lag cause leads to fall through the cracks. This is the VLOOKUP Tax: 400 hours per year spent chasing missing records (DRA, 2026).
Why This Costs More Than You Think
A CMO spending £50,000 per month on LinkedIn Ads might see 500 reported leads. If 36% of those never reach the CRM — a conservative estimate based on common industry benchmarks — that is 180 lost opportunities. At a 5% close rate and £10,000 average deal size, that is £90,000 per month in pipeline that never exists.
The board never sees this number. The lead never entered the CRM. It never appears in any report.
2. Why does LinkedIn report more leads than my CRM shows?
The Answer: View-through conversions inflate your LinkedIn dashboard. LinkedIn counts a lead if a user saw your ad and later converted on your site — even if they never clicked. If your CRM only recognizes click-throughs, those view-through leads go missing.
The Ghost Lead Scenario
You spend £50,000 on a LinkedIn campaign for a whitepaper.
LinkedIn reports: 500 leads.
Your CRM shows: 320 leads.
Missing: 180 leads.
Where did they go?
Many were mobile users who saw the ad, later visited your site on a desktop, and converted. Without a Cross-Channel Hub to stitch these identities together, those leads are marked "Direct" or "Unknown." They still converted. Your CRM just cannot prove it.
This is not a lead quality problem. This is an identity resolution problem.
3. How does signal loss compound over time?
The Answer: Every month your LinkedIn Ads run without CRM data flowing back, the algorithm learns from the wrong signal. It optimizes toward form fills — the weakest conversion event — instead of closed revenue. Your budget chases volume, not value.
January: A prospect clicks your LinkedIn ad. LinkedIn records a click.
February: The prospect submits a demo request. LinkedIn records a conversion.
March to May: The deal progresses through discovery, demo, proposal, and legal review. All inside your CRM. LinkedIn sees none of it.
June: The deal closes at £45,000. LinkedIn never learns this happened.
The algorithm thinks the campaign drove one form fill. It doubles down on audiences that generate form fills. Next month, cost per lead drops. Pipeline stays flat. You cannot figure out why.
This is the compounding cost of signal loss. It is not a reporting problem. It is an optimization problem.
4. How do I fix the LinkedIn-to-CRM signal gap?
The Answer: Move from siloed platforms to a Federated Marketing Intelligence model. Connect LinkedIn Ads data directly to your CRM through a unified truth layer. Use automated sync, multi-model attribution, and anomaly detection to close the gap.
The Truth Layer Protocol
Step 1: Automated Sync. Connect your CRM to your analytics platform in real time. Pull deal data, contact creation dates, and pipeline stage changes as they happen. Do not rely on CSV exports. Do not rely on manual entry.
Step 2: Multi-Model Attribution. Run First-Touch, U-Shaped, and Linear attribution models simultaneously. Compare them. If LinkedIn shows high performance on First-Touch but drops on U-Shaped, it is starting journeys but not finishing them. That is valuable intelligence, not a tracking failure.
Step 3: Anomaly Detection. Set alerts that fire when the gap between LinkedIn reported leads and CRM records exceeds 10%. Do not wait for the quarterly review. Fix it the same week.
5. What can I do tomorrow without buying anything?
The Answer: Three actions any CMO can take this week to quantify their signal loss and begin closing it.
Compare your numbers. Export LinkedIn Ads reported conversions for the last 90 days. Export CRM lead records for the same period. Calculate the gap. If it exceeds 15%, you have a signal loss problem worth solving.
Audit your UTM structure. Inconsistent UTM parameters are a leading cause of attribution failure. Standardize your naming convention across all LinkedIn campaigns. Use the same source, medium, and campaign values every time.
Check your tracking pixels. Verify your LinkedIn Insight Tag fires correctly on your landing pages. Use the LinkedIn Partner Program's Tag Inspector or your browser's developer tools. A pixel that fails silently can cause 100% of your leads to go untracked.
6. The CMO Survival Checklist
The Answer: Before your next board meeting, verify these five items. Each one protects your ability to prove marketing ROI.
Revenue reconciliation. Does your marketing dashboard match your bank account? If not, identify which source is out of alignment.
Attribution model audit. Run at least two attribution models side by side. If they tell different stories, you need a unified truth layer.
Pipeline-to-spend ratio. Divide your total LinkedIn pipeline value by your total LinkedIn spend. If this ratio is declining month over month, signal loss is compounding.
Lead-to-record match rate. Calculate the percentage of LinkedIn reported leads that have corresponding CRM records. Below 80% is a red flag.
SDR follow-up lag. Measure the time between lead creation and first contact. Leads contacted within 5 minutes achieve a 32% close rate — 2.6x higher than those contacted after 24 hours (Optifai, 2026). A response delay beyond 5 minutes drops qualification odds by 80% (Oldroyd et al., 2011).
FAQ
Q: Is signal loss the same as bad ad targeting? A: No. Signal loss is a tracking failure between platforms. Bad targeting is an audience selection problem. You can have perfect targeting and still lose 30% of your leads to signal loss.
Q: Will fixing signal loss reduce my reported leads? A: Yes — temporarily. Your LinkedIn dashboard will show fewer leads because view-through inflations are removed. Your actual closed revenue will increase because the algorithm optimizes toward real pipeline.
Q: How do view-through conversions inflate my reported ROAS? A: LinkedIn counts a conversion when a user sees your ad and later converts, even without clicking. This inflates your reported ROAS by 20% to 40% depending on your attribution window (DRA, 2026). The CEO sees a higher number than the bank account supports.
Q: Does this work with Salesforce and HubSpot? A: Yes. The Truth Layer connects to any SQL-based CRM or API-connected platform. HubSpot, Salesforce, Pipedrive, Zoho — if it stores pipeline data, it can feed back into the attribution model.
Q: How does this affect my LinkedIn Ads algorithm scoring? A: Without CRM feedback, LinkedIn optimizes toward form fills. With CRM feedback, it optimizes toward qualified pipeline and closed revenue. Your cost per closed deal drops because the algorithm learns which audiences actually buy.
Reclaim Your Strategic Velocity
Stop guessing which leads are real. Connect your LinkedIn data to your CRM through one truth layer and walk into your next board meeting with numbers that match the bank account. Prove marketing ROI with DRA
References
Data Research Analysis. (2026). Unified marketing analytics platform. https://dataresearchanalysis.com
Gartner. (2024). Gartner CMO survey reveals marketing budgets have dropped to 7.7% of overall company revenue in 2024. https://www.gartner.com/en/newsroom/press-releases/2024-05-13-gartner-cmo-survey-reveals-marketing-budgets-have-dropped-to-seven-point-seven-percent-of-overall-company-revenue-in-2024 [Source requires login — URL preserved as-is]
HubSpot. (2026). The top challenges marketing leaders expect to face in 2026. HubSpot Blog. https://blog.hubspot.com/marketing/anticipated-marketing-challenges
Oldroyd, J. B., McElheran, K., & Elkington, D. (2011, March). The short life of online sales leads. Harvard Business Review. https://hbr.org/2011/03/the-short-life-of-online-sales-leads
Optifai. (2026). Lead response time benchmarks — how fast is fast enough? (939 companies). Optifai Research. https://optif.ai/learn/questions/lead-response-time-benchmark/
Spencer Stuart. (2026). CMO tenure 2026: Snapshot of an expanding role for marketing leaders. https://www.spencerstuart.com/research-and-insight/cmo-tenure-2026-snapshot-of-an-expanding-role-for-marketing-leaders


