
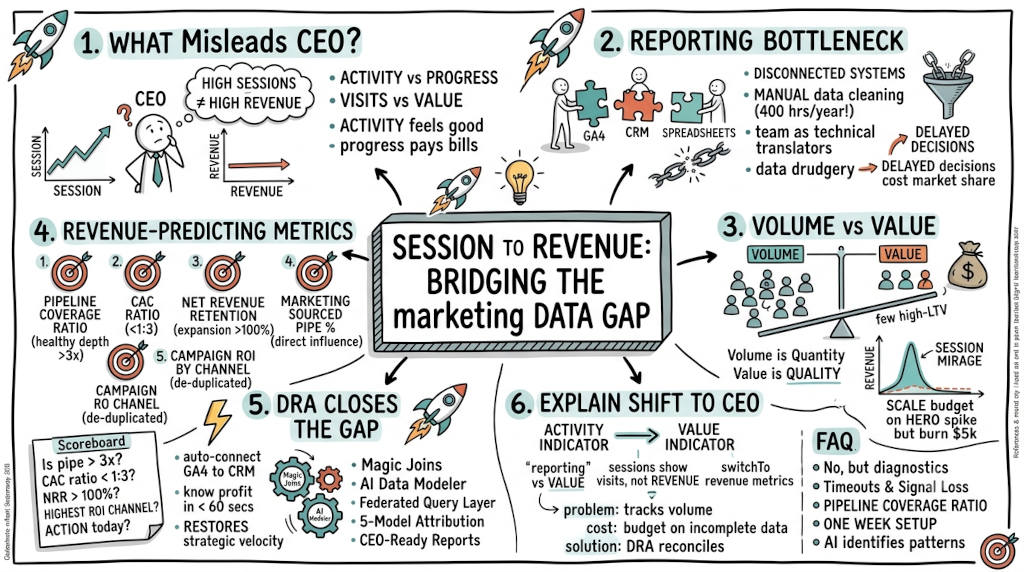
summary: Sessions measure website visits, not business growth. Yet most marketing dashboards lead with session counts as a proxy for success. This creates a dangerous gap between what the dashboard shows and what the bank account says. CMOs report rising traffic. CEOs see flat revenue. The disconnect erodes executive trust and forces strategic decisions on incomplete data. This article explains why sessions are a vanity metric, which metrics actually predict revenue, and how to bridge the gap between marketing data and financial outcomes. The goal is to give CMOs the language and framework to reframe the conversation with their CEO.
1. What is a session and why does it mislead your CEO?
The Answer: A session is a group of user interactions within a time window. It measures visits, not value. High sessions do not equal high revenue. When you report session growth to your CEO, you are reporting activity, not progress. Activity feels good. Progress pays the bills. Your CEO knows the difference.
CMOs face a specific trap. You show a dashboard with rising sessions. Your CEO looks at the bank account. The numbers do not match. This is not a reporting error. It is a metric failure. Sessions hide the truth about customer intent. They create a smoke screen between your team and actual ROI.
The boardroom cost of vanity metrics
You hired your team for strategic work. Instead they spend mornings reporting on session growth. This is data drudgery. You pay high salaries for strategists to count clicks. Your CEO does not care about clicks. Your CEO cares about pipeline, conversion, and revenue. Every hour your team spends on session reports is an hour your competitor spends on strategy.
2. How do sessions create a technical bottleneck in your reporting?
The Answer: Sessions live in GA4. Customers live in your CRM. These systems do not talk to each other. Your team spends hours in spreadsheets trying to match sessions to sales. This manual labor is the invisible drain on your profit margins.
The disconnect forces your team to act as technical translators. They stitch data together by hand. They build workarounds. They create shadow reports. This is The Invisible Drain — Pillar 5 of the CMO Crisis. Your team wastes up to 400 hours a year on manual data maintenance.
What to tell your CEO about the data gap
Say this directly: "GA4 tracks visits. Our CRM tracks customers. These systems are disconnected. Every report you see today requires manual stitching. That means delay, errors, and hidden costs."
Your CEO does not need to hear about session timeouts or attribution windows. They need to hear about accuracy and speed. When data is disconnected, decisions are delayed. Delayed decisions cost market share.
3. What is the difference between volume and value in marketing data?
The Answer: Volume is the quantity of interactions. Value is the quality of the result. A single session from a high-LTV customer is worth more than 1,000 sessions from low-intent users. Vanity metrics hide this difference. You need financial-grade data to see which channels actually drive profit.
The Session Mirage: a real scenario
Imagine you run a campaign for a new product.
The volume reality: You see a 50% session spike in GA4. You feel like a hero.
The value reality: Your actual sales drop by 10%. The new traffic is low quality.
The strategic failure: You scale budget based on the spike. You burn $5,000 before you see the revenue gap.
This is The ROI Proof Gap (Pillar 1). Marketing spend goes up. Revenue does not follow. The data looks good. The business does not.
4. Which metrics actually predict revenue?
The Answer: Sessions predict attention. They do not predict revenue. The metrics that predict revenue track the full pipeline from interest to income. A CEO trusts pipeline coverage, customer acquisition cost ratio, and net revenue retention. These metrics connect spend to outcome.
Here are the five metrics that belong in your CEO report:
Pipeline coverage ratio: Total pipeline value divided by revenue target. A 3x or higher ratio signals healthy pipeline depth.
Customer acquisition cost (CAC) ratio: CAC divided by annual contract value. Top performers keep this under 1:3.
Net revenue retention (NRR): Revenue retained from existing customers including expansion. Above 100% signals growth.
Marketing sourced pipeline percentage: The share of pipeline directly influenced by marketing activity.
Campaign ROI by channel: Revenue per dollar spent, de-duplicated across touchpoints.
The weekly scoreboard your CEO will trust
Every Monday, your CEO should be able to answer these questions:
Is pipeline coverage above 3x?
Is CAC ratio healthy?
Is NRR above 100%?
Which channel delivered the highest ROI last week?
What action do we take today?
If your dashboard cannot answer these questions, it is decoration, not a tool. Prove marketing ROI to your CEO with reports that reconcile spend to revenue. Your CEO knows this. That is why they do not trust the session report.
5. How does DRA close the gap between sessions and revenue?
The Answer: Data Research Analysis (DRA) connects GA4 sessions to CRM revenue automatically. Our engine uses Magic Joins to infer relationships between customer IDs and ad sessions. You stop counting visits. You start knowing profit. In under 60 seconds.
DRA restores your strategic velocity. You stop waiting for manual data cleaning. You move from finding session counts to knowing your numbers. Your reports match your bank account.
The features that make this work
Magic Joins: Connect customer data to ad sessions without manual mapping.
AI Data Modeler: Turn plain English questions into modeled answers instantly.
Federated Query Layer: Join spend and revenue data where it lives. No file movement.
5-Model Attribution: See first-touch through U-shaped attribution simultaneously.
CEO Ready Reports: Walk into board meetings with numbers that reconcile.
6. How do you explain this shift to your CEO?
The Answer: Use three sentences. "We have been reporting activity instead of value. Sessions show visits, not revenue. I am switching to metrics that connect spend to outcome so our reports match the bank account."
The three-point briefing for your next meeting
Name the problem: "Our current metrics track volume, not value. Sessions do not predict revenue."
Show the cost: "We cannot tell which channels actually drive profit. We are making budget decisions on incomplete data."
Offer the solution: "DRA reconciles our spend data with our revenue data. We will know our actual ROI in real time."
FAQ
Q: Should I stop tracking sessions entirely? A: No. Sessions are useful as a diagnostic tool for trend direction and technical health checks. They should not measure strategic success or drive budget decisions.
Q: Why do my session counts in GA4 not match my ad platform clicks? A: This is caused by session timeouts, privacy signal loss, and cross-platform deduplication gaps. An independent truth layer reconciles these differences.
Q: What is the single metric my CEO should watch this quarter? A: Pipeline coverage ratio. It answers the question "do we have enough potential revenue to hit our target?" directly.
Q: How long does it take to switch from vanity metrics to revenue-attributed reporting? A: With DRA's Magic Joins and Federated Query Layer, most teams are running CEO-ready reports within the first week. No data migration required.
Q: Can AI help bridge the session-to-revenue gap? A: Yes. An AI Data Modeler identifies patterns between high-value sales and specific user paths. This lets you optimize for profit rather than volume.
Your next step
Walk into your next board meeting with numbers that match your bank account. Show your CEO how marketing spend connects to revenue.
References
Data Research Analysis. (2026). Unified marketing analytics platform. https://dataresearchanalysis.com
Kleene. (2024, September 3). Vanity metrics: The 6 numbers flattering your reporting in 2026. https://kleene.ai/blog/vanity-metrics
Nielsen. (2024). 2024 annual marketing report: Maximizing ROI in a fragmented world. https://www.nielsen.com/insights/2024/maximizing-roi-in-a-fragmented-world-nielsen-annual-marketing-report/
SeenThis. (2025, October 23). Beyond vanity metrics: How to measure digital advertising ROI for real business growth. https://seenthis.co/resources/news-article/beyond-vanity-metrics-how-to-measure-digital-advertising-roi-for-real-business-growth
ZoomInfo. (2026, March 20). Vanity metrics: What they are, why they mislead GTM teams, and what to measure instead. Pipeline. https://pipeline.zoominfo.com/marketing/marketing-vanity-metrics


