
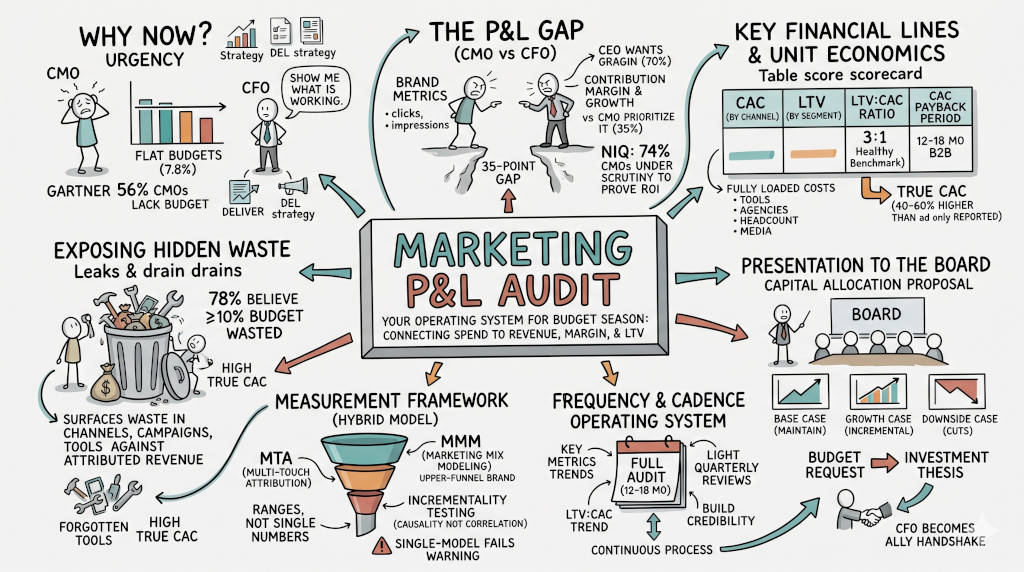
Summary: A Marketing P&L Audit is a structured financial review that connects every dollar of marketing spend to revenue, margin, and customer lifetime value. It exposes waste, proves contribution, and gives CMOs the language CFOs already speak. With marketing budgets flat at 7.8% of company revenue and only 35% of CMOs tracking the revenue and margin metrics CEOs actually care about, the audit is no longer optional. It is the operating system for surviving budget season with your influence intact.
1. What is a Marketing P&L Audit and why does every CMO need one now?
The Answer: A Marketing P&L Audit is a line-by-line financial review of every marketing dollar spent, measured against revenue contribution, gross margin impact, and customer lifetime value. It forces marketing to present itself as an investment function with unit economics, not a cost center with activity reports. With budgets flat at 7.8% of company revenue in 2026, the audit is the only mechanism that separates defensible spend from invisible waste (Sullivan, 2026; McDonnell, 2026).
How a Marketing P&L differs from your company's income statement
A traditional income statement covers the whole business: all operating revenue, COGS, payroll, interest, and taxes. It is a compliance document built for the IRS and your auditor (Agile Brand Guide, 2025).
A Marketing P&L is different. It isolates only the revenue and expenses tied to marketing activity. It is not a tax document. It is a decision document (SimpleTiger, 2024). It answers one question: after every marketing dollar is spent, did the business come out ahead?
The traditional P&L shows net income. The Marketing P&L shows net marketing contribution. That is the number your CFO wants to see (SimpleTiger, 2024; Tenon, 2025).
The Urgency Behind the Audit
Gartner reports that 56% of CMOs say their organization lacks the budget required to deliver their 2026 strategy (McDonnell, 2026). When the budget is insufficient, the first question from the CFO is: "Show me what is working." Without a P&L audit, most CMOs cannot answer that question with financial precision. They default to activity metrics. The CFO defaults to cuts (Haus, 2026; Moorman, 2026).
2. The Marketing P&L Audit line structure
The Answer: Every Marketing P&L Audit follows a sequence of six financial lines. Each line answers a specific question about where money went and what returned. Missing a line means missing a leak (SimpleTiger, 2024; Tenon, 2025; LiveFlow, 2024).
Here is the core structure every audit must cover. Use this as your template.
P&L Line | What It Answers | Formula |
|---|---|---|
1. Marketing-Attributed Revenue | How much revenue did marketing generate? | Direct + Indirect + Affiliate revenue |
2. Cost of Goods Sold (COGS) | What did it cost to deliver the product or service sold? | Direct fulfillment costs |
3. Gross Marketing Profit (GMP) | Is the core economics of what we sell healthy before marketing costs? | Revenue – COGS |
4. Total Marketing OPEX | What did we spend to run the marketing engine? | Sum of all marketing expenses (see breakdown below) |
5. Net Marketing Contribution | Did marketing pay for itself and contribute to company profit? | GMP – Total Marketing OPEX |
6. Key Performance Metrics | Is the engine sustainable? | CAC, LTV:CAC, ROMI, Payback Period |
Defining your top line: the revenue breakdown
Most CMOs put the wrong number in the revenue row. Revenue is not one thing. It is at least three things. Understanding the difference is where the audit earns its credibility (SimpleTiger, 2024; PublicMitra, 2026).
Direct Sales Revenue. Sales you can trace to a specific campaign or channel. A prospect clicks a paid search ad and buys. That sale is directly attributable.
Indirect Sales Revenue. Sales influenced by marketing but not traceable to a single campaign. A prospect reads three blog posts, sees a retargeting ad, and converts through a direct URL six weeks later. The revenue is real. The attribution is distributed.
Affiliate and Partnership Revenue. Revenue earned through commission-based partnerships, joint ventures, or referral agreements.
Separate these three streams in your audit. If you combine them, your CAC looks artificially low and your ROI looks artificially high. Precision starts at the top line (SimpleTiger, 2024).
3. Marketing OPEX: what goes into the expense column
The Answer: Total Marketing OPEX is the sum of every cost required to run the marketing engine. Most teams undercount their expenses by 40 to 60% because they only count ad spend. The audit requires fully loaded costs across seven categories (SimpleTiger, 2024; Tenon, 2025).
The 7 expense categories every Marketing P&L must itemize
Paid Advertising. Platform spend on Google Ads, Meta, LinkedIn, programmatic display, and traditional media. Include retargeting and branded search (Visionary Marketing, 2026).
Content and SEO. Writers, editors, graphic designers, SEO tools, keyword platforms, and content management subscriptions.
Tools and Technology. CRM licenses, analytics platforms, attribution software, automation tools, CDP subscriptions, and data warehouse costs (Artemis GTM, 2026).
Headcount and Staffing. Salaries, benefits, and contractor costs for the entire marketing team. Include fractional roles like shared designers or analysts (Visionary Marketing, 2026).
Agencies and Consultants. Retainers and project fees paid to external SEO firms, paid media agencies, creative shops, PR firms, and fractional CMOs (Visionary Marketing, 2026; Pedowitz Group, 2025).
Events and Sponsorships. Conference booths, trade show fees, hosted dinners, sponsored webinars, and speaking engagement costs.
Research and Intelligence. Competitive intelligence tools, survey platforms, focus group costs, and market data subscriptions.
Strategic Pete reports that businesses often discover three to five forgotten tools during audits, each costing $2,000 to $5,000 annually. When you calculate True CAC with all seven categories included, the real number is often 40 to 60% higher than the ad-spend-only figure. That hidden cost is where profit leaks (Strategic Pete, 2026).
4. How to build a Marketing P&L Audit in 9 steps
The Answer: Building a Marketing P&L Audit is not complex. It is tedious. But the steps are mechanical. Follow this sequence once and it becomes a repeatable process you run quarterly (SimpleTiger, 2024).
Step 1: Define the audit period
Choose a timeframe. Most teams start with a trailing twelve months. Enterprise teams often run fiscal quarters. The period must match the reporting cycle your CFO uses. If finance reports by quarter, so should you.
Step 2: Gather the data
Pull revenue data from your CRM and billing system. Pull expense data from your marketing tools, finance system, and procurement records. Work with your finance team to get COGS data. Missing COGS is the most common error in first-time audits (SimpleTiger, 2024).
Step 3: Detail marketing revenue
Separate revenue into the three streams defined in Section 2: Direct, Indirect, and Affiliate. Be conservative. If you cannot attribute it confidently, put it in indirect and flag it. Over-claiming attribution is the fastest way to lose CFO trust (SimpleTiger, 2024; PublicMitra, 2026).
Step 4: Itemize marketing expenses
List every cost across all seven categories from Section 3. Pull every subscription invoice. Ask procurement for a complete vendor list. Many teams discover three to five forgotten tools that have been auto-renewing for years (Strategic Pete, 2026).
Step 5: Calculate Gross Marketing Profit (GMP)
Subtract COGS from Marketing-Attributed Revenue. This tells you whether the product economics are healthy before you layer on marketing costs. If GMP is negative, you have a pricing or product cost problem, not a marketing problem (SimpleTiger, 2024; FICILCOM, 2026).
Step 6: Calculate Net Marketing Contribution
Subtract Total Marketing OPEX from GMP. This is the number your CFO wants. It answers: after every marketing dollar was spent, did we make money or lose it? (SimpleTiger, 2024; Tenon, 2025; Best, 2024)
A positive number means marketing is a profit center. A negative number means marketing is a cost center. That distinction changes how the board sees you (Best, 2024).
Step 7: Add Key Performance Indicators
Calculate the four KPIs that make the P&L actionable:
Customer Acquisition Cost (CAC). Total marketing and sales expenses divided by new customers acquired. Include fully loaded costs.
LTV:CAC Ratio. Customer lifetime value divided by CAC. A healthy benchmark is 3:1 or higher. Below 3:1 and the unit economics are too thin to scale.
CAC Payback Period. How many months it takes for a customer to generate enough gross profit to cover their acquisition cost. For B2B, 12 to 18 months is typical (Strategic Pete, 2026; LiveFlow, 2024).
Return on Marketing Investment (ROMI). (Marketing-Attributed Revenue – Total Marketing OPEX) divided by Total Marketing OPEX. Greater than 1 means marketing is profitable. Greater than 2 means marketing is a growth engine (Tenon, 2025; Best, 2024).
Step 8: Run a comparative analysis
Compare this period to the last period. Which lines moved? Did CAC increase while revenue stayed flat? Did a channel that worked last quarter stop working this quarter? The audit is not a one-time snapshot. It is a trend line. Trends reveal what snapshots hide (SimpleTiger, 2024).
Step 9: Review, iterate, and set the next audit date
Share the completed audit with finance first. Ask the CFO: does this match what you see? If it does not, find the discrepancy before the board sees it. Then set a calendar invite for the next quarterly review. The cadence builds credibility (Gavrikov, 2026).
5. Why do most CMOs fail the P&L conversation with their CFO?
The Answer: McKinsey found that 70% of CEOs measure marketing impact based on year-over-year revenue growth and margin, but only 35% of CMOs track those metrics as a top priority (Bettati et al., 2025). That 35-point gap is not an abstraction. It is the precise distance between where marketing thinks its job ends and where the business thinks it begins (NielsenIQ, 2025; Bettati et al., 2025). NIQ reports that 74% of CMOs say they are under more scrutiny to prove marketing ROI than ever before (NielsenIQ, 2025). CMOs present brand metrics. CFOs want contribution margin.
The Language Barrier Is the Trust Barrier
The CMO-CFO partnership has barely moved in four years, rated just 4.5 on a 7-point scale for building a business case for marketing spending (Moorman, 2026). Fewer than half of companies report that marketing and finance work together on growth (Moorman, 2026). The audit closes this gap by forcing both parties onto a shared financial model. Once the CFO can see CAC, LTV, and payback period on one page, the conversation shifts from "Why are we spending this?" to "Where should we invest next?" (Adweek, 2026; Roberts, 2026; Bettati et al., 2025).
6. How does a Marketing P&L Audit expose hidden budget waste?
The Answer: Haus research from 2026 found that 78% of decision-makers believe at least 10% of their marketing budget is wasted due to insufficient measurement (Haus, 2026). Seven percent of those respondents believe the waste is 30% or higher (Haus, 2026). The audit surfaces this waste by forcing every channel, campaign, and tool to justify its cost against attributed revenue, not impressions or clicks.
Finding the Silent Performance Drains
The most common discoveries in a first audit are forgotten tool subscriptions, channels that produce zero pipeline, and attribution models that assign credit to the wrong touchpoints (Strategic Pete, 2026). When measurement systems struggle to capture long-term value, organizations gravitate toward investments that deliver easier returns that may not be incremental to the business (Haus, 2026). The audit forces honesty by requiring every claim to pass the incrementality test.
7. What measurement framework should a P&L Audit use?
The Answer: The audit must use a hybrid measurement model that combines multi-touch attribution, incrementality testing, and marketing mix modeling (MMM). No single model tells the full story. Multi-touch attribution handles lower-funnel channels. MMM captures upper-funnel brand investment. Incrementality testing proves causality rather than correlation (Haus, 2026; Gavrikov, 2026). The audit presents ranges with confidence intervals, not single numbers.
Why Single-Model Attribution Fails
Haus found that only 49% of senior marketing and finance leaders can clearly explain their marketing measurement approach to the board (Haus, 2026). The other half measure what is expected by leadership, highly visible, or easy to access (Haus, 2026). When measurement systems struggle to capture long-term value, organizations gravitate toward investments that deliver easier returns. The audit forces honesty by requiring every claim to pass the incrementality test.
8. How should a CMO present the Marketing P&L Audit to the board?
The Answer: Present a capital allocation proposal, not a budget request (Roberts, 2026). Structure the presentation around three scenarios: a base case showing what current investment maintains, a growth case showing what incremental investment generates at the channel level, and a downside case showing what happens to revenue if the budget is cut (Adweek, 2026; Roberts, 2026). Each scenario must include CAC trajectory, LTV:CAC ratio, and estimated payback period (Roberts, 2026).
From Budget Defense to Investment Thesis
ChiefViews reports that the top-performing companies build unified scorecards with finance, focusing on revenue contribution, capital efficiency, and growth impact (Roberts, 2026). When a CMO walks into the boardroom with a capital allocation proposal defended by data, scenario analysis, and projected returns, the CFO becomes an ally rather than an auditor (Roberts, 2026; Bettati et al., 2025). The audit is the foundation of that proposal. Without it, the CMO is guessing.
9. How often should a Marketing P&L Audit be conducted?
The Answer: Run a full audit every 12 to 18 months, supplemented by lightweight quarterly reviews of key financial metrics (Strategic Pete, 2026). The quarterly reviews should cover pipeline contribution by channel, cost per qualified opportunity, and LTV:CAC ratio trend (Strategic Pete, 2026). The full audit adds deeper analysis of tool stack utilization, channel mix versus competitors, and attribution model accuracy.
The Cadence Builds Credibility
Otrenix reports that companies between $1M and $50M ARR should plan a serious marketing audit at least every 18 to 24 months (Gavrikov, 2026). The compounding discipline of regular audits produces stronger pipeline performance than any tactical investment (Gavrikov, 2026). For enterprise companies, treat audits as a permanent operations function with annual full audits and quarterly lightweight reviews (Gavrikov, 2026). Consistency is what turns the CFO from skeptic to partner.
10. When marketing is not the problem
The Answer: Not every profit shortfall is a marketing failure. A P&L Audit reveals when the issue is bloated OPEX, discount-driven margin erosion, or returns eating revenue silently. Marketing cannot fix a product that costs too much to deliver (Common Thread Collective, 2024; Saras Analytics, 2026a, 2026b).
Diagnosing the real leak
If Gross Marketing Profit is healthy but Net Marketing Contribution is negative, the problem is marketing OPEX. Cut waste or reallocate budget.
If GMP is too thin, the problem is unit economics: your product costs too much to make or you discount too deeply. Marketing cannot fix a 15% gross margin with better ad targeting. That is a pricing conversation with the CFO, not a campaign optimization problem (Saras Analytics, 2026b; klarmetrics, 2026).
If revenue looks strong but net sales are weak, the problem is returns or discounts. This is especially common in ecommerce and SaaS businesses with aggressive promotional cycles. The audit surfaces the gap between gross sales and net sales, which most marketing dashboards never show (Common Thread Collective, 2024; Chu, 2026).
The audit is honest. It tells you when the problem is marketing. It also tells you when it is not. Both answers build trust (Common Thread Collective, 2024).
11. What happens to CMOs who skip the P&L Audit?
The Answer: They lose budget, influence, and eventually their seat. NIQ reports that only 69% of CMOs say their CEO and CFO support long-term brand investment, a sharp decline from 80% the previous year (NielsenIQ, 2025). The CMO Survey reports that when profits fall short, 53.1% of executives cut expenses rather than invest in growth, and marketing expenses are cut 45.4% of the time, more frequently than any other category (Moorman, 2026).
The Cost of Inaction
McKinsey found that only 30% of CMOs believe there is a clearly defined view on what constitutes marketing ROI in their organization, down from 40% in the previous survey (Bettati et al., 2025). Meanwhile, 84% of CMOs now prioritize ROI as their primary metric for budget allocation, yet fewer than half can defend that ROI with financial rigor (NielsenIQ, 2025; Haus, 2026). The audit is not a nice-to-have. It is the difference between a CMO who survives budget season and one who does not.
FAQ
Q: Can a small marketing team run a P&L Audit without external help? A: Yes. Start with a DIY internal audit covering CAC, LTV, and payback period by channel. Otrenix reports this costs only team time and takes 4 to 8 weeks (Gavrikov, 2026).
Q: What is the first metric to fix if our audit reveals gaps? A: Start with True CAC. Include all marketing and sales expenses, not just ad spend. Compare it to LTV by customer segment. If the ratio is below 3:1, the audit has already paid for itself by showing you where to cut (Strategic Pete, 2026).
Q: How do we measure brand investment in a P&L Audit? A: Use marketing mix modeling (MMM) to capture upper-funnel impact. Pair it with holdout tests to prove causality. Adweek argues that CMOs must defend brand investment with the same rigor they apply to performance media (Adweek, 2026).
Q: Does AI replace the need for a manual P&L Audit? A: No. Gartner found that only 30% of marketing organizations have mature AI readiness capabilities (Sullivan, 2026). AI can accelerate data collection and analysis, but the strategic framework of the audit requires human judgment and CFO collaboration (Roberts, 2026; Bettati et al., 2025).
Q: What is the single most important output of a Marketing P&L Audit? A: A one-page Marketing Investment Scorecard that shows attributed revenue, gross margin contribution, blended CAC, LTV:CAC ratio, and payback period. This becomes the single source of truth for marketing's contribution to the business (Roberts, 2026).
CTA
Stop defending your budget with dashboards. Build your Marketing P&L Audit and speak the language that keeps your seat at the table.
References
SimpleTiger. (2024, July 9). Marketing P&L: Creating a marketing profit and loss statement. Retrieved July 1, 2026, from https://www.simpletiger.com/blog/marketing-profit-and-loss-statement
Tenon. (2025, April 24). How to build the ultimate P&L template for enterprise marketing teams. Retrieved July 1, 2026, from https://www.tenonhq.com/article/pl-template-for-enterprise-marketing
Common Thread Collective. (2024, January 16). A marketer's guide to mastering the profit and loss statement. Retrieved July 1, 2026, from https://commonthreadco.com/blogs/bridges/redesigning-profit-and-loss-for-marketers
Chu, H. (2026, April 26). Gross sales vs. net sales: What every ecommerce merchant needs to know. TrueProfit. Retrieved July 1, 2026, from https://trueprofit.io/blog/gross-sales-vs-net-sales
Saras Analytics. (2026a, February 25). How returns distort contribution margin and pricing decisions. Retrieved July 1, 2026, from https://www.sarasanalytics.com/blog/how-returns-distort-contribution-margin-pricing
Strategic Pete. (2026, May 19). Marketing audit checklist: 15 areas every CEO must review. Strategic Pete. Retrieved July 1, 2026, from https://strategicpete.com/blog/marketing-audit-checklist-ceo-review-areas/
Best, R. (2024, March 1). How can companies measure the profit impact of their marketing budget. Market-Based Management. Retrieved July 1, 2026, from https://mbm-book.com/2024/03/how-can-companies-measure-the-profit-impact-of-their-marketing-budget/
Adweek. (2026, May 12). How CMOs should actually think about ROI. Retrieved July 1, 2026, from https://www.adweek.com/brand-marketing/how-cmos-should-actually-think-about-roi/
NielsenIQ. (2025, November 19). CMOs face a 'reputation and results' reckoning. Retrieved July 1, 2026, from https://nielseniq.com/global/en/news-center/2025/cmos-face-a-reputation-and-results-reckoning-according-to-niqs-2026-outlook/
Sullivan, L. (2026, May 11). CMOs find AI helps adapt to lower budgets. MediaPost. Retrieved July 1, 2026, from https://www.mediapost.com/publications/article/415003/cmos-find-ai-helps-adapt-to-lower-budgets.html
Haus. (2026, March 18). Half of marketing leaders can't defend how they measure ROI. Retrieved July 1, 2026, from https://www.prnewswire.com/news-releases/half-of-marketing-leaders-cant-defend-how-they-measure-roi-boards-are-starting-to-notice-302716554.html
Roberts, E. (2026, May 21). How CMOs prove ROI to CEOs and CFOs in uncertain markets 2026. ChiefViews. Retrieved July 1, 2026, from https://chiefviews.com/how-cmos-prove-roi-to-ceos-and-cfos-in-uncertain/
Bettati, A., Jacobs, J., Robinson, K., & Tas, R. (2025, June 16). Tapping into the full power of CMOs. McKinsey & Company. Retrieved July 1, 2026, from https://www.mckinsey.com.br/capabilities/growth-marketing-and-sales/our-insights/the-cmos-comeback-aligning-the-c-suite-to-drive-customer-centric-growth
Moorman, C. (2026, March 31). Marketing contracts under economic pressure. The CMO Survey. Retrieved July 1, 2026, from https://cmosurvey.org/marketing-contracts-under-economic-pressure-despite-growing-value-and-ai-gains/
Gavrikov, D. (2026, April 30). B2B marketing audit: Complete guide 2026. Otrenix. Retrieved July 1, 2026, from https://otrenix.com/b2b-marketing-audit/
McDonnell, A. (2026, May 18). Gartner: CMOs face pressure to deliver AI growth. Business Chief. Retrieved July 1, 2026, from https://businesschief.com/news/gartner-cmos-face-pressure-to-deliver-ai-growth
Agile Brand Guide. (2025). Profit & Loss (P&L). Retrieved July 1, 2026, from https://agilebrandguide.com/wiki/marketing-funnel/profit-loss-pl/
PublicMitra. (2026, January 11). Digital marketing P&L management in India: A practical framework. Retrieved July 1, 2026, from https://publicmitra.com/transform-digitally/digital-marketing-pl-management-in-india-a-practical-framework-for-profitable-growth/
LiveFlow. (2024, July 28). How to build a killer marketing profit and loss statement + free template. Retrieved July 1, 2026, from https://liveflow.com/blog/build-a-killer-marketing-profit-and-loss-statement
Visionary Marketing. (2026, April 15). CMO marketing budget survey 2026: 2,400 leaders surveyed. Retrieved July 1, 2026, from https://visionary-marketing.co.uk/blog/cmo-marketing-budget-survey-2026
Artemis GTM. (2026, February 21). GTM tech stack audit checklist + free grader. Retrieved July 1, 2026, from https://artemisgtm.ai/blog/gtm-tech-stack-audit/
Pedowitz Group. (2025, September 10). The $10M budget black hole: Where marketing money goes to die. Retrieved July 1, 2026, from https://www.pedowitzgroup.com/blog/the-10m-budget-black-hole-where-marketing-money-goes-to-die
FICILCOM. (2026, April 1). Management accounting for marketing: How to visualize campaign-level profitability. Retrieved July 1, 2026, from https://www.ficilcom.jp/en/blog/marketing-management-accounting-guide
Saras Analytics. (2026b, March 5). Are your discounts profitable or just revenue illusions? Retrieved July 1, 2026, from https://www.sarasanalytics.com/blog/are-ecommerce-discounts-profitable
klarmetrics. (2026, April 8). Margin erosion: 5 places it hides before the P&L. Retrieved July 1, 2026, from https://klarmetrics.com/margin-erosion/


