
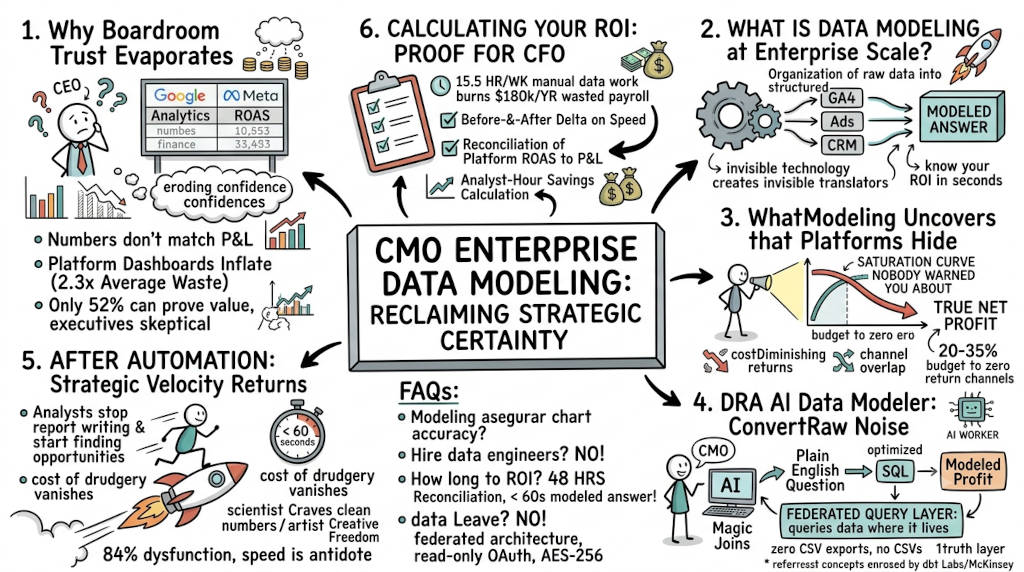
Summary: Platform dashboards over-report ROAS by 2.3x on average. Only 52% of CMOs can prove marketing's value to the C-suite. Data modeling closes the trust deficit by reconciling spend to actual P&L revenue across every channel. It eliminates the $180K annual waste of manual data work, reveals saturation curves platforms hide, and drops reporting cycles from three days to under 60 seconds. DRA's Federated Query Layer queries your data where it lives — no migration, no engineers, read-only OAuth. First reconciled view in 48 hours. Walk into your boardroom with one version of the truth.
Your board just asked for the ROI on last quarter's spend. Your analyst says the report needs three more days. Three days you do not have. Data modeling eliminates that delay. It turns raw platform data into CFO-ready profit numbers before the boardroom door closes. You stop translating spreadsheets. You start leading with certainty.
1. Why does your boardroom trust evaporate when you present marketing data?
The Answer: The numbers do not match the P&L. Platform dashboards show success. The bank account tells a different story. Your CEO sees the gap. Your CFO distrusts the source. Data modeling closes that gap by reconciling spend to actual revenue across every channel and platform. You walk into the boardroom with one version of the truth.
The ROI Trust Deficit
Google Analytics says ROAS is 4.2. Meta says 3.8. The finance team's P&L says your margin is 12 percent. Same quarter. Same spend. Completely different answers. This is the ROI Proof Gap. It erodes executive confidence every time you present.
This is not a rare problem. Only 52% of CMOs and senior marketing leaders say they can prove marketing's value and receive credit for its contribution to business outcomes (Gartner, 2024). CFOs (40%) and CEOs (39%) are the top executives most skeptical of marketing's value. Nearly half of CMOs — 47% — say marketing is viewed as an expense rather than a strategic investment.
Platform-reported numbers are structurally inflated. They count every conversion they touch. They ignore overlap. They ignore organic demand that would have converted anyway. Analysis of 792 marketing mix models across 194 advertisers found that platforms over-report their own performance by 1.2x to 2.3x on average, with extreme cases exceeding 4x (Cassandra, 2025). A 150-brand study in 2026 confirmed that platform-reported ROAS was 2.3x higher than ground-truth incremental ROAS measured via holdout tests (GrowWithBA, 2026). At $100K monthly spend, the gap is manageable. At $500K, it can exceed 30 percent (Cresva, 2025). At $1M, you are operating blind.
Data modeling fixes this by creating a single truth layer that all platforms feed into. Every dollar of spend maps to every dollar of revenue. Your CFO can trace it. Your CEO can trust it. You can defend it.
Read deeper: The Marketing Profit and Loss (P&L) Audit walks through exactly how to reconcile marketing spend against your company's actual financials.
2. What is data modeling and why does it matter at enterprise scale?
The Answer: Data modeling is the process of organizing raw data from disconnected tools into a structured business view. It turns fragmented events from GA4, Meta, LinkedIn, and your CRM into clean facts like Net Profit Per Channel. For a CMO managing seven-figure budgets, this makes the technology invisible. You stop acting as a technical translator. You move from requesting reports to knowing your ROI in seconds.
You Did Not Hire Strategists to Write SQL
Your team is expensive. Every hour a marketing director spends pulling data in Looker is an hour stolen from campaign strategy and creative direction. The Monday morning VLOOKUP ritual is not a skill. It is a tax on your highest-paid talent.
The numbers back this up. Marketing teams spend an average of 14.5 hours per week managing and collecting customer data manually (Treasure Data, 2024). Forbes reported that 41% of marketers spend at least half their time preparing data for use in campaigns and analysis (SOCi, 2024). McKinsey found knowledge workers spend 19% of their workweek on information gathering — 380 hours per year per person before data cleaning even begins (McKinsey Global Institute, 2012). Across industries, analysts lose 9.1 hours per week to inefficiencies, equating to $21,613 per analyst per year in wasted productivity (dbt Labs & The Harris Poll, 2025).
For a 10-person marketing team, the math is grim. Five hours of manual data work per person per week burns 200 hours a month. At a blended hourly rate of $75, that is $15,000 in monthly waste. $180,000 a year. And the reports are still three days late.
Modeling automates this. You ask a question in English. You get a modeled answer instantly. The technology does the translation. You do the leading.
3. What does data modeling uncover that platform dashboards hide?
The Answer: Platform dashboards hide cost. They show you ROAS. They do not show you diminishing returns. They do not show you channel overlap. They do not show you true net profit. Modeling exposes these gaps with financial-grade precision. You see which channels actually drive incremental revenue and which ones are just expensive exercise equipment.
The Saturation Curve Nobody Warned You About
Platforms have a structural incentive to show you strong performance. Their pixels measure their own contribution using proprietary attribution logic. Meta reports 26% more conversions on average than third-party analytics tools. Google Ads over-attributes by 15-20% when modeled data is applied (Pixis, 2026). Neither platform measures what happens when you run the same audience on Google, Meta, and LinkedIn simultaneously.
Modeling reveals saturation curves. It shows you the exact spend level where Facebook stops delivering new customers and starts recycling the same audience at a higher price. It identifies channels with headroom you have not touched yet. It quantifies the overlap between Google branded search and brand awareness campaigns.
Incrementality tests consistently show 50-70% of retargeted users would have converted without seeing a retargeting ad (EncubIQ, 2026). Platform attribution cannot identify channels with zero incremental return — and in a typical portfolio, 20-35% of budget flows to those channels (Cassandra, 2025).
This is not a reporting exercise. It is a capital allocation decision. When the board asks why the budget should go up next quarter, you point to the saturation curves and the headroom projections. You are no longer guessing.
4. How does the DRA AI Data Modeler convert raw noise into CFO-ready profit numbers?
The Answer: Data Research Analysis uses a Federated Query Layer to model your data where it lives. No data movement. No ETL failures. Our AI Data Modeler, powered by Gemini 2.0, converts your plain English questions into complex SQL automatically. Magic Joins identify relationships between your tables without a single line of manual code. You connect your sources. You ask a question. You get modeled profit in under 60 seconds.
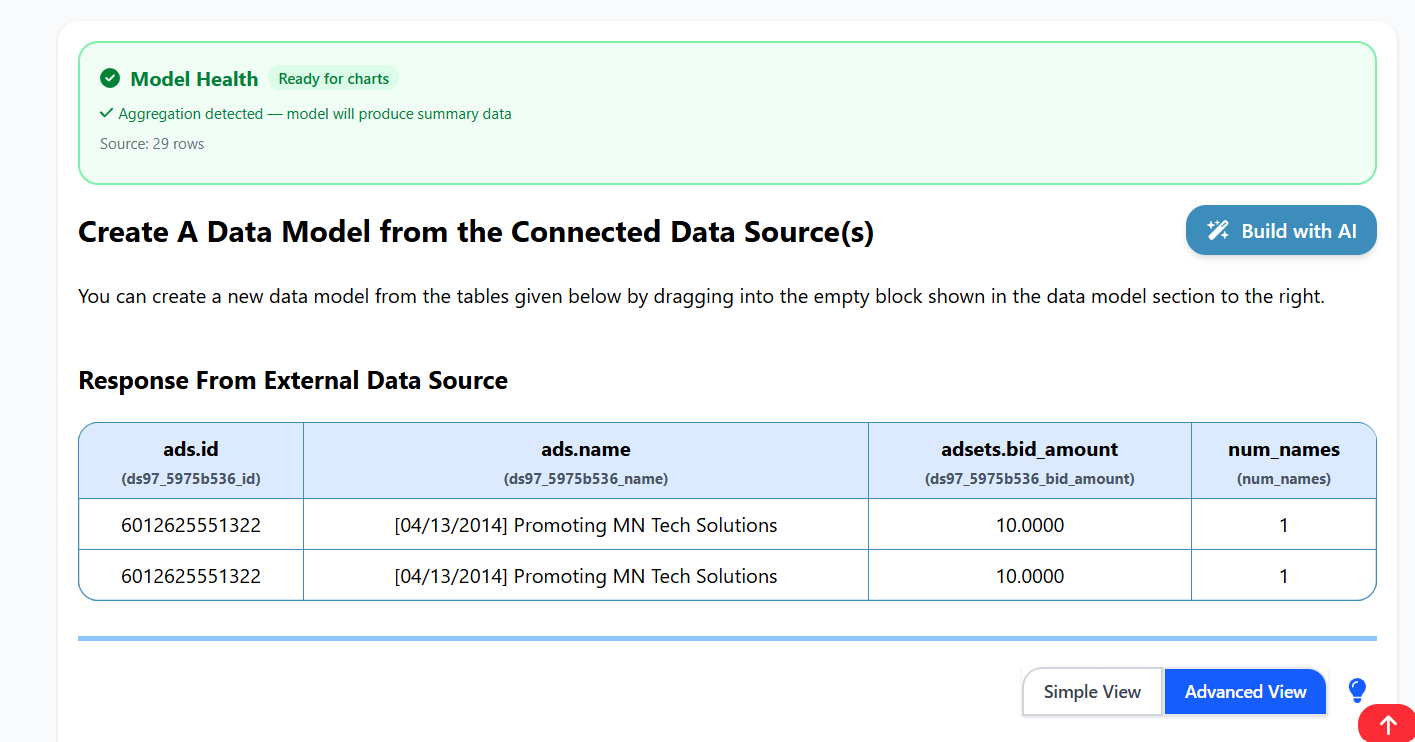 Sample data being shown in the data model builder
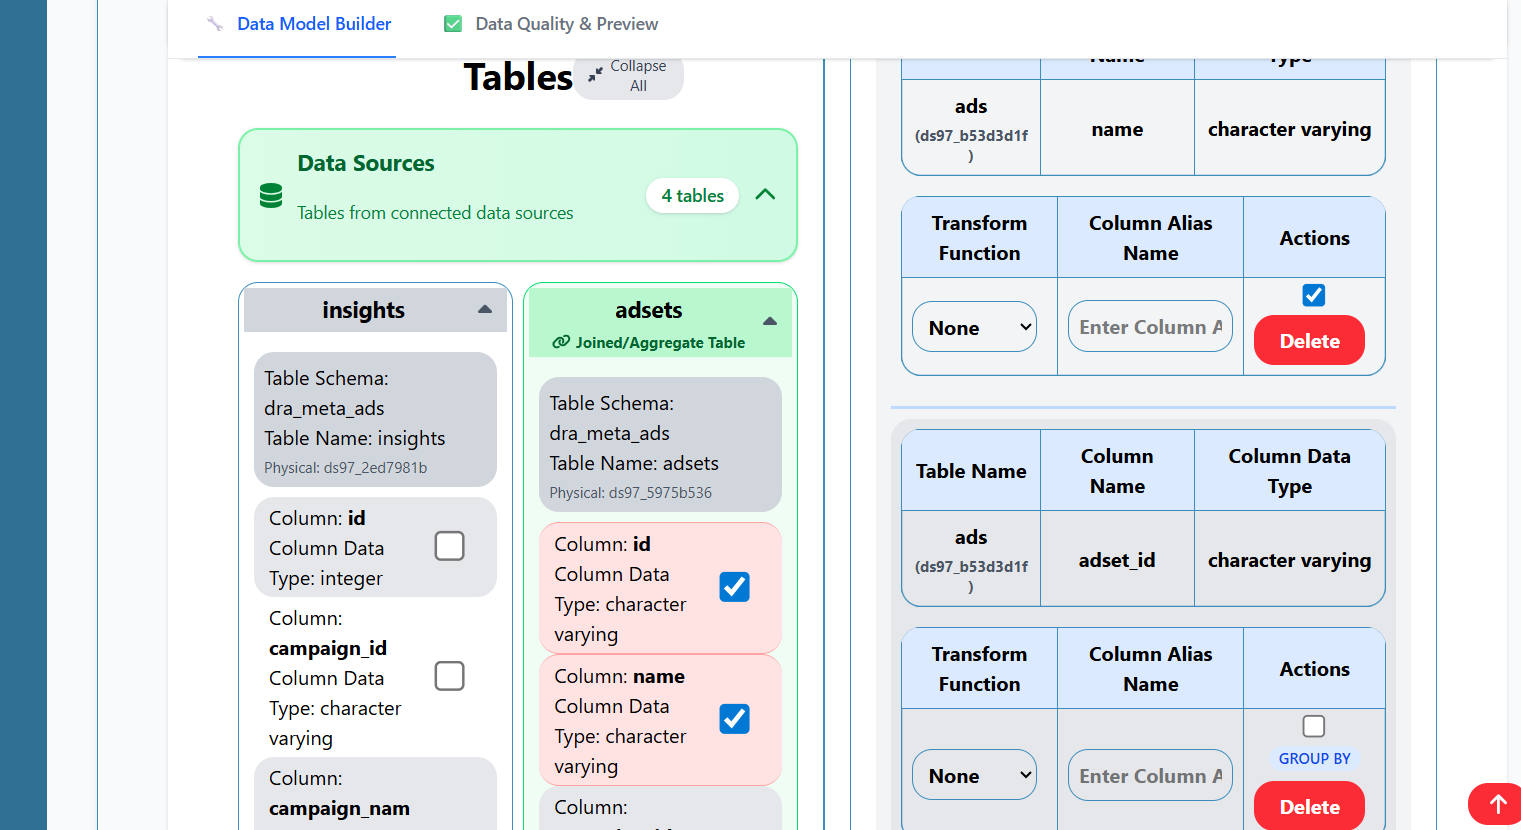 Columns in the data model that have been selected from the data sources
One Truth Layer. No Data Engineers Required.
Here is what happens under the hood: DRA connects to your GA4, your ad platforms, your CRM, and your internal databases via read-only OAuth. The Federated Query Layer joins spend data from Meta with revenue data from your PostgreSQL warehouse. Magic Joins infer the relationships between user IDs, email addresses, and transaction records automatically. No manual mapping. No CSV exports. No pivot tables.
The AI Data Modeler then structures this into a clean business view. You type: "Show me net profit per channel for Q2, excluding retargeting." The engine translates your English into optimized SQL, runs the query across your live data, and returns a number you can take to the CFO.
The ROI of an Intelligence Layer Over Your Current Tech Stack breaks down the cost comparison between hiring more analysts and deploying an intelligence layer.
Enterprise Security That Your CIO Will Approve
DRA connects to platforms using read-only OAuth scopes. We never modify your campaigns or data. All connections use AES-256 encryption at rest and in transit. Revoke access anytime. Your data stays where it lives. We query it. We do not warehouse it.
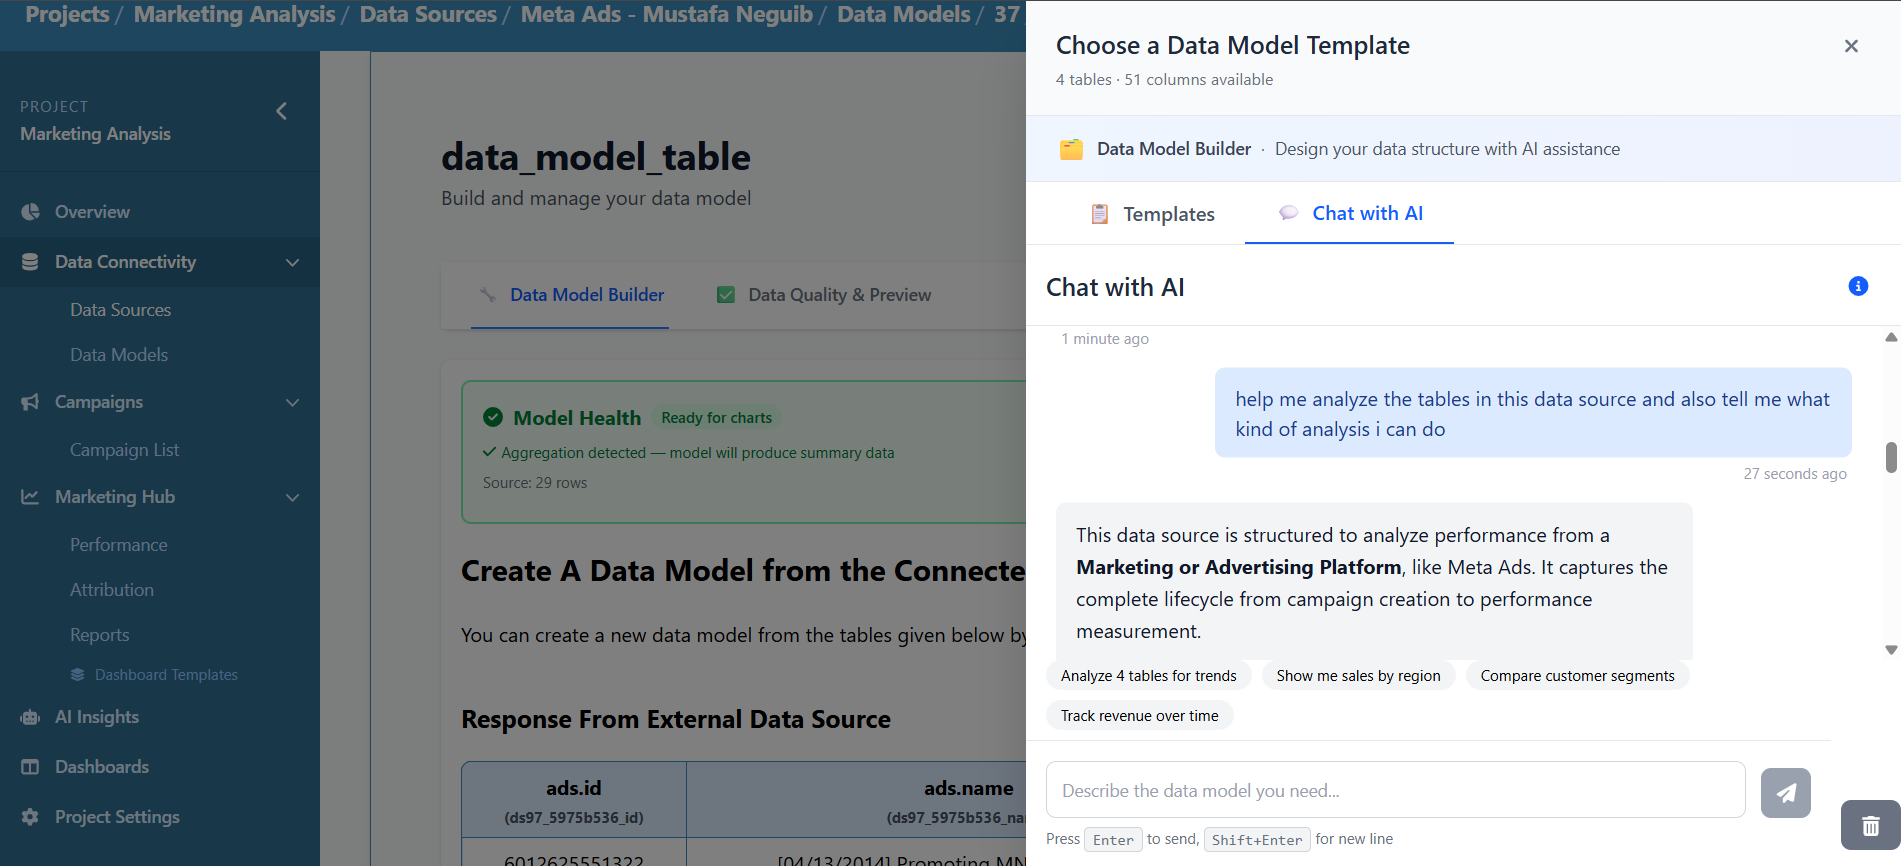 AI Data Modeler in action
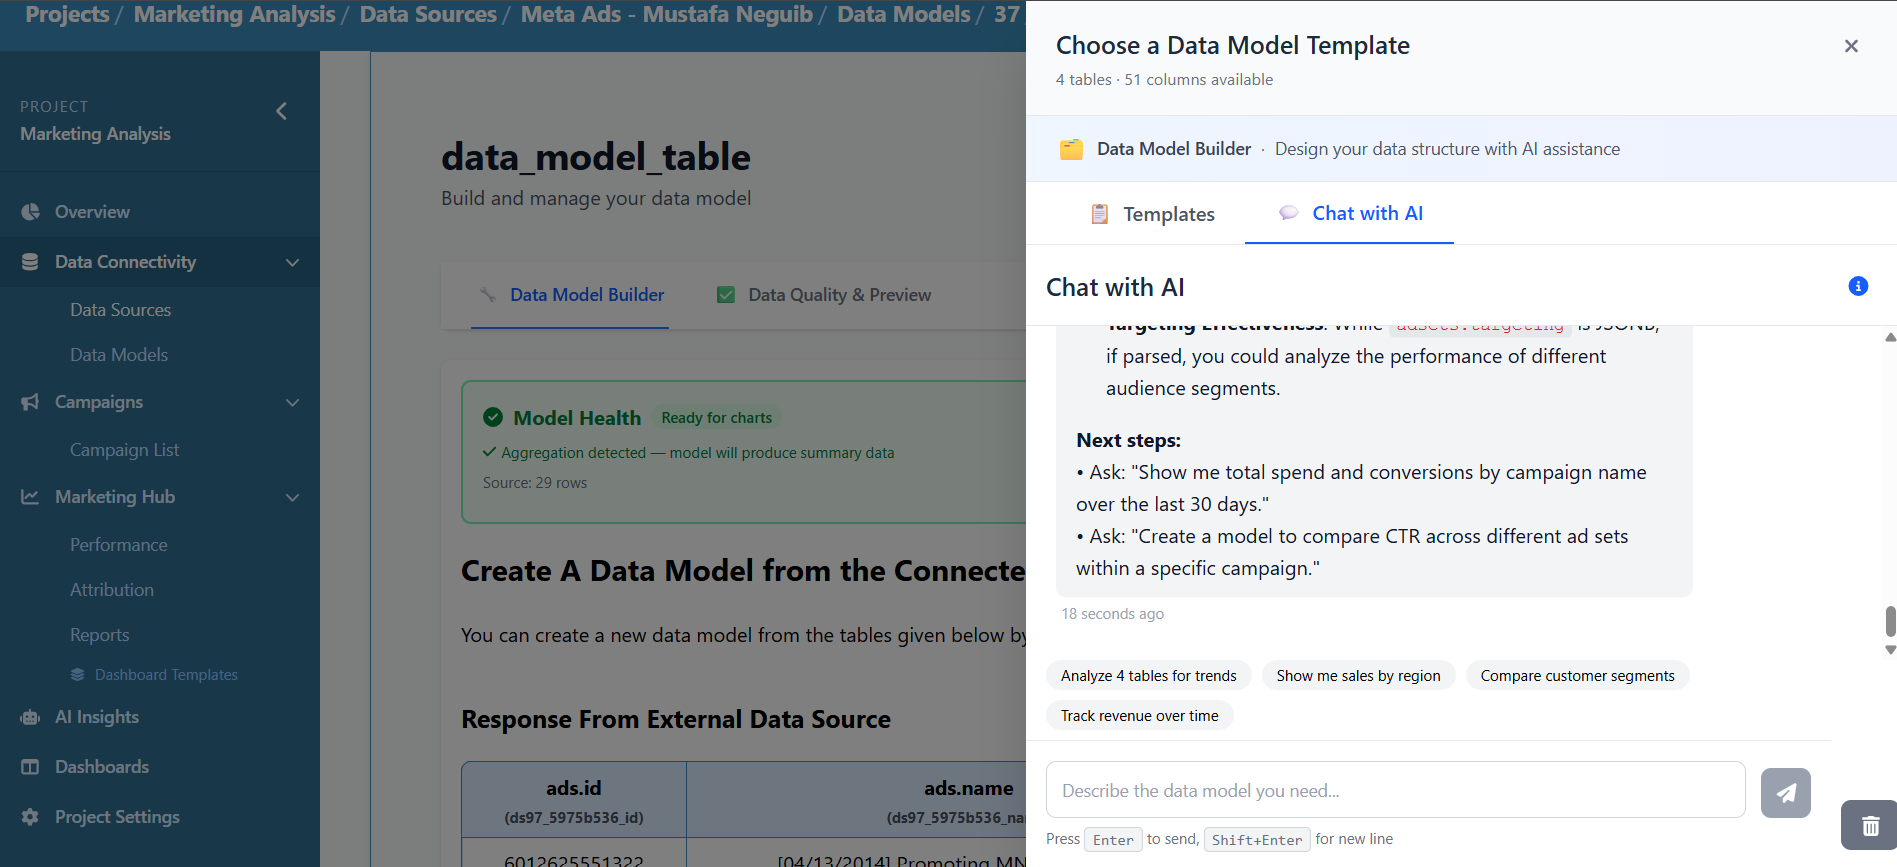 AI Data Modeler gives analysis and results to the user
5. What happens to your team after you automate the technical bottleneck?
The Answer: Strategic velocity returns. Your analysts stop writing reports and start finding opportunities. Your directors stop waiting for data and start making decisions. Your C-suite stops doubting the numbers and starts acting on them. The cost of data drudgery vanishes. The focus shifts to growth.
From Data Janitor to Strategic Leader
The Scientist-Artist identity is real. Half your brain craves clean, defensible numbers. The other half needs creative freedom to pivot fast. When modeling handles the technical work, both halves operate at full capacity.
A 2024 RevOps survey found that 57% of critical GTM decisions are made before fresh data is even available (Packed Data Services, 2024). A 2025 benchmark of 68 revenue organizations found that 79% of revenue-critical systems were still fed by batch pipelines, with a median end-to-end latency of 26 hours (Packed Data Services, 2025). GA4's standard reports carry a processing latency of up to 48 hours — Google's own documentation confirms that data can take 24-48 hours to finalize (Google Analytics Help, n.d.).
You see a channel performance shift on Monday morning. You ask DRA in plain English what moved. You get the answer in seconds. You reallocate budget by lunch. Your competitor is still waiting for their Wednesday analytics standup.
This is strategic velocity. It is the primary competitive weapon in a market where speed compounds and delay kills margins. 84% of CMOs report high levels of strategic dysfunction within their function (Gartner, 2025). Speed is the antidote.
6. What proof do you need before your CFO approves the investment?
The Answer: A before-and-after delta on reporting speed, a reconciliation of platform ROAS to actual P&L numbers, and an analyst-hour savings calculation. DRA provides all three within the first 48 hours of connection. No data migration. No custom development. Just read-only OAuth and immediate modeled answers.
The ROI Calculation Your CFO Will Actually Read
Run these numbers before your next budget conversation:
Current reporting cycle: how many days from spend to board-ready report?
Current analyst hours per week on data wrangling: multiply by blended hourly rate
Platform ROAS gap: pick your highest-spend channel and compare platform-reported ROAS against actual P&L revenue attribution
Present those three numbers. Then present the modeled alternative: query-to-answer in under 60 seconds, zero analyst hours on SQL, and a single truth layer that finance signs off on.
The average difference between platform-reported ROAS and true ROAS is 38% (Celerian Digital, 2026). When you sum platform-reported conversions across all channels without deduplication, total attributed revenue exceeds actual revenue by an average of 142% (Celerian Digital, 2026). A Gartner survey found marketers waste $12.9 million annually on average due to poor data quality — misleading findings, bad decisions, wasted resources (Gartner, cited in Adverity, 2025).
The investment case makes itself. You are not asking for budget. You are stopping a structural loss.
Frequently Asked Questions
Q: How is data modeling different from a BI dashboard like Tableau or Looker? A: A dashboard shows you charts. Data modeling ensures the charts are accurate. BI tools visualize what you feed them. DRA models the data first, then visualizes it. Without modeling, even the most expensive dashboard is just a pretty lie.
Q: Do we need to hire data engineers to set this up? A: No. The AI Data Modeler handles the technical mapping automatically. You connect your sources via OAuth. Magic Joins identify the relationships. You ask questions in English. Zero SQL. Zero engineers.
Q: How long until we see our first modeled ROI? A: First reconciled view within 48 hours of connecting your sources. First modeled profit answer in under 60 seconds after setup. Most teams are fully operational within the first week.
Q: Will our data leave our existing infrastructure? A: No. DRA uses federated querying. Your data stays where it lives — in your GA4, your CRM, and your internal databases. We query it in place. We do not copy it. We do not warehouse it.
Q: How does this compare to agent-based platforms like Cresva or Lifesight? A: Those platforms build agent layers on top of moved copies of your data, which introduces synchronization lag and ETL fragility. DRA queries your data where it lives using federated architecture. The AI Data Modeler converts your English into SQL natively — you are not locked into a proprietary agent language. Your data. Your warehouse. One truth layer.
Q: What security standards does DRA meet? A: Read-only OAuth for all platform connections. AES-256 encryption at rest and in transit. No data movement — all queries run federated against your live sources. Open-source core under MIT license for full technical transparency.
Reclaim Your Strategic Certainty
Stop presenting numbers your CFO cannot trace. Stop waiting three days for reports your competitors generate in three seconds. Data modeling is the bridge between raw platform noise and executive certainty. Cross it.
Prove ROI to your CEO and CFO with a single truth layer that reconciles every dollar of spend to revenue.
References
Adverity. (2025). Fixing the foundation: The state of marketing data quality 2025. https://www.adverity.com/state-of-play-research-data-quality-2025
Cassandra. (2025). Marketing attribution software is lying to you: 792-model proof. https://cassandra.app/blog/marketing-attribution-software-analysis
Celerian Digital. (2026, January 29). How to calculate true ROAS: Beyond platform reporting. https://celeriandigital.com/how-to-calculate-true-roas-beyond-platform-reporting/
Cresva. (2025, November 6). The attribution lie: Your ROAS is 30-40% inflated. https://cresva.ai/blog/the-attribution-lie-platform-reported-roas-inflated
dbt Labs & The Harris Poll. (2025). The analyst revolution: Unlocking tomorrow's AI initiatives. https://8698602.fs1.hubspotusercontent-na1.net/hubfs/8698602/q3-2026_harris-poll_aw/dbtLabs%20%2B%20Quietly_Thought%20Leadership%20Report-%20The%20Analyst%20Revolution_final_20250916%20_%20EXTERNAL.pdf
EncubIQ. (2026, February 5). The $100 billion measurement illusion: ROAS vs. incrementality [Whitepaper]. https://encubiq.com/signals-blog/whitepapers/the-100-billion-measurement-illusion
Gartner. (2024, September 18). Gartner survey finds only 52% of senior marketing leaders can prove marketing's value and receive credit for its contribution to business outcomes. https://www.gartner.com/en/newsroom/press-releases/2024-09-18-gartner-survey-finds-only-52-percent-of-senior-marketing-leaders-can-prove-marketings-value
Gartner. (2025, March 25). Gartner survey reveals 84% of CMOs report high levels of strategic dysfunction. https://www.gartner.com/en/newsroom/press-releases/2025-03-25-gartner-survey-reveals-84-percent-of-cmos-report-high-levels-of-strategic-dysfunction
Google. (n.d.). [GA4] Data freshness and service level agreement constraints. Google Analytics Help. https://support.google.com/analytics/answer/12233314
GrowWithBA. (2026, April 24). The attribution crisis: 150-brand study in 2026. https://growwithba.com/blog/attribution-reality-2026-study
McKinsey Global Institute. (2012). The social economy: Unlocking value and productivity through social technologies. https://www.mckinsey.com/industries/technology-media-and-telecommunications/our-insights/the-social-economy
Packed Data Services. (2024). The GTM data latency problem. https://www.packeddata.com/blog/gtm-data-latency-problem
Pixis. (2026). Cross-platform attribution without platform bias: How to build a neutral view of your media mix. https://pixis.ai/blog/cross-platform-attribution-without-platform-bias-how-to-build-a-neutral-view-of-your-media-mix/
SOCi. (2024, April). Why most marketers today are 'data janitors' (as reported by Forbes). https://www.forbes.com/sites/cmo/2024/04/17/why-most-marketers-today-are-data-janitors/
Treasure Data. (2024). Global survey on marketing data management (as cited in Coupler.io, 2025). https://blog.coupler.io/why-marketing-teams-need-automation/


