
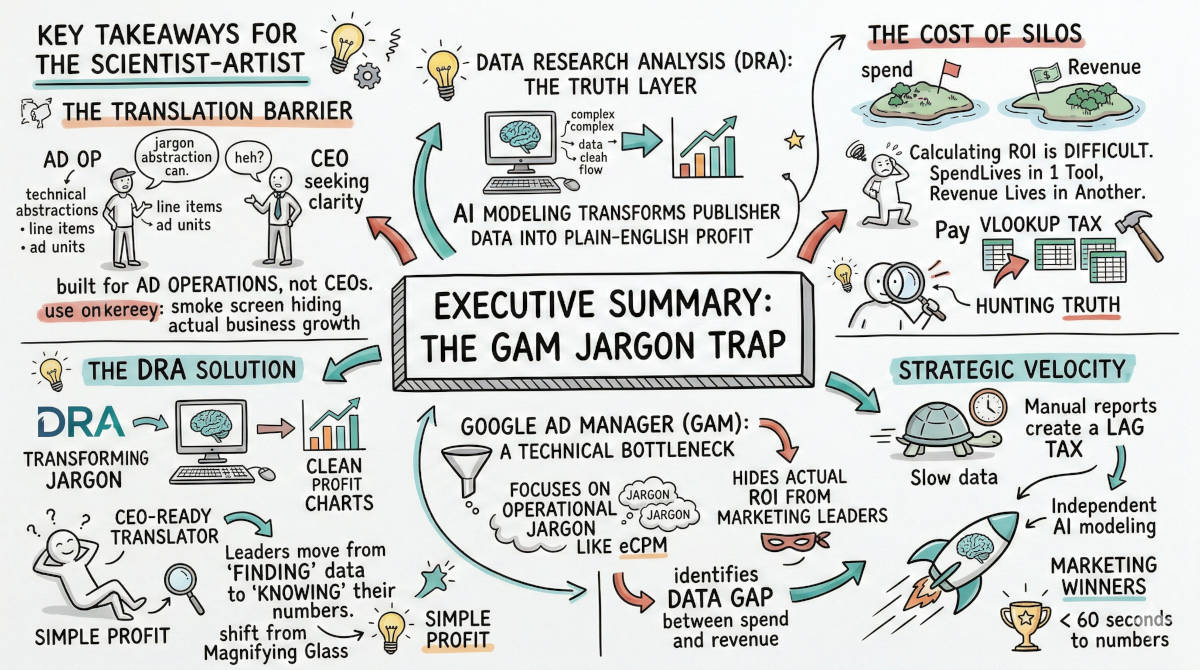
Summary: Google Ad Manager dominates the publisher ad server market, with 73% of publishers relying on it (Advertiser Perceptions, 2022). Yet GAM reports eCPM and fill rates, not profit. Revenue lives in GAM; spend lives in Google Ads and Meta. These systems never connect. CMOs cannot give the CEO a single ROI number, a core symptom of the CMO Crisis (McIntyre et al., 2025; Van Mossevelde, 2025). Board pressure on marketing ROI rose 21% from 2023 (CMO Survey, 2025). The fix is a Truth Layer that unifies revenue and spend data in real time. DRA closes the gap so every stakeholder sees one number that matches the bank account.
1. Why is Google Ad Manager ROI so hard to measure for publishers?
The Answer: GAM was built to serve ads, not calculate profit. It tracks impressions, eCPM, and fill rates. It does not track the money you spent acquiring those users. CEOs do not ask for eCPM. They ask: "You spent $500K on ads last quarter. How much came back?" Board pressure on marketing ROI rose 21% from 2023 to 2025 (CMO Survey, 2025).
Without a connection between spend and revenue, every ROI number is a guess.
The data gap costs real money
Your ad spend lives in Google Ads and Meta. Your ad revenue lives in GAM. These platforms never touch. Teams export CSV files and stitch them by hand. That manual process hides the truth.
Consider a content site spending $50,000 on Meta Ads:
Meta reports a low cost per click. The campaign looks efficient.
GAM shows rising eCPM. The ad inventory looks valuable.
The CEO sees two good reports and authorizes more spend.
But neither report shows the connection. The CMO scales the campaign with the best CPC. Profit stays flat. No single dashboard can answer why.
2. How do you calculate GAM ROI when spend and revenue never meet?
The Answer: You cannot calculate GAM ROI inside GAM. The platform has no cost data. You must join two separate data sets: acquisition cost from your ad platforms and earned revenue from GAM.
The formula is the same as any ROI calculation:
ROI = (Revenue — Cost) / Cost x 100
The problem is not the formula. The problem is getting Revenue and Cost into the same room.
What the VLOOKUP tax costs your team
Teams solve this by hand. Export GAM line items. Export Google Ads campaigns. Open two spreadsheets. Write VLOOKUP formulas. Hope the dates and IDs match.
The VLOOKUP Tax is real. Senior analysts spend 8 to 12 hours per month reconciling these two data sets. That is not analysis. That is janitorial work.
3. What specific GAM metrics should a CMO track for real ROI?
The Answer: Most GAM reporting focuses on operational metrics. CPM, fill rate, and impression volume matter for ad ops. They do not matter for profit. CMOs need a different set of numbers. Only 15% of organizations qualify as high performers in martech ROI (McIntyre et al., 2025).
Metrics that matter for P and L reporting:
Metric | What It Tells You | Where It Lives |
|---|---|---|
Net ad revenue after platform fees | Actual money earned | GAM |
Customer acquisition cost (CAC) | What each visitor cost | Google Ads / Meta |
Revenue per visitor | How much each visitor earned | Joined data |
True ROAS | Revenue / CAC per campaign | Joined data |
Profit by channel | Which channel actually delivers | Joined data |
Three of those five require joined data. That is why CMOs cannot get them from any single platform.
The dashboard gap explains the trust gap
Publishers run between 4 and 7 ad tech tools (Advertiser Perceptions, 2022). Each tool has its own dashboard. No two dashboards agree. The CEO sees one number in GAM, another in GA4, and a third in the bank statement. The CMO cannot explain the difference. DRA unifies your MarTech stack so every stakeholder sees the same number.
This is Pillar 3 of the CMO Crisis: The Executive Trust Gap. When dashboards show success but the bank account is flat, trust erodes. Marketers who can demonstrate ROI are increasingly the ones who keep their budgets (Van Mossevelde, 2025).
4. Can you see real-time revenue in Google Ad Manager?
The Answer: Standard GAM reports have a processing delay of 3 to 48 hours. You cannot see today's revenue until tomorrow. That lag forces reactive decisions on last weeks data. Ad ops teams accept this. CMOs should not.
Real-time visibility requires an automated sync engine that pulls raw data from GAM's API every few minutes. This is what the DRA Native GAM Sync does. It structures line item data automatically and makes it queryable in seconds.
Strategic velocity depends on data speed
A 48-hour report lag means your competitors are two days ahead. They see a campaign underperforming at 10 AM. You see it at 10 AM two days later. By then, your budget is spent. This is the reality most CMOs face: 59% report they have insufficient budget to execute their 2025 strategy (Gartner, 2025).
This is Pillar 2: The Strategic Velocity Gap. The speed of your data determines the speed of your decisions.
5. How do you turn GAM jargon into a boardroom-ready ROI number?
The Answer: Stop trying to find ROI inside GAM. You will not find it there. Use a data modeler that sits above both your spend platforms and your revenue platforms. Ask a question in plain English. Get the answer as one number.
DRAs AI Data Modeler does this. You type: "What was my net profit from Meta Ads in Q2 after GAM platform fees?" The engine generates the SQL. It joins Meta's cost data with GAM's revenue data. It returns one number in under 60 seconds.
What to tell the CFO
Share this table in your next board meeting:
Scenario | What You See | What the CFO Wants |
|---|---|---|
Pipeline snapshot | "We drove 50K visits from Meta" | "Did those visits generate profit?" |
GAM report | "eCPM is up 12 percent" | "What is net revenue after platform fees?" |
Campaign analysis | "This campaign at $1.20 CPC" | "What was the ROAS after all costs?" |
Monthly board deck | 4 dashboard screenshots | One number. Profit. |
The gap between the left column and the right column is what DRA closes. DRA unifies your MarTech stack so every stakeholder sees the same number (Data Research Analysis, n.d.).
6. Where can I find my real publisher ROI today?
The Answer: Start with three exports. Pull GAM revenue data by line item. Pull Google Ads spend data by campaign. Pull Meta Ads spend data by campaign. Join them in a spreadsheet by campaign name and date.
This is the manual first step. It will take 4 to 6 hours. It will show you approximate numbers. It will also show you why the manual approach does not scale past one campaign.
The automated alternative
DRAs Federated Query Layer joins GA4, Google Ads, Meta, SQL databases, and GAM data without moving it. You see spend and revenue in one view. The difference between the manual VLOOKUP and the automated sync is the difference between guessing and knowing.
FAQ
Q: What is the difference between CPM and ROI in GAM? A: CPM measures the cost of 1,000 ad impressions. ROI measures whether those impressions produced profit. DRA joins acquisition costs with GAM earnings to calculate the second number.
Q: Why does my GAM data not match my GA4 reports? A: GAM tracks ad requests and impressions. GA4 tracks sessions and user engagement. They use different counting methods. DRAs Truth Layer reconciles both sources into one number you can trust.
Q: How much time do teams waste reconciling GAM data? A: Senior analysts spend 8 to 12 hours per month joining GAM revenue with ad spend. This is Pillar 5: The Invisible Drain. Teams waste 400 hours a year on manual data maintenance.
Q: Can DRA pull GAM data in real time? A: Yes. DRAs Native GAM Sync pulls raw line item data every few minutes. You see today's performance today, not 48 hours later.
Q: What is a Truth Layer? A: A Truth Layer sits between your data sources and your dashboard. It joins spend, revenue, and operational data into a single source of truth. The CEO and the CMO look at the same number.
Q: Do I need SQL knowledge to use DRA? A: No. DRAs AI Data Modeler converts English questions into complex SQL. You ask in plain language. The engine finds the answer.
CTA
Stop explaining dashboard differences to the CEO. Stop stitching spreadsheets on Monday morning. Stop acting as a technical translator for tools that were never built for leaders. Connect marketing spend to revenue with DRAs unified analytics platform.
References
Advertiser Perceptions. (2022, February). SSP report: Second half 2021. AdExchanger. https://www.adexchanger.com/online-advertising/google-reigns-supreme-in-latest-advertiser-perceptions-ssp-report-but-competition-is-tight-among-everyone-else/
CMO Survey. (2025, Spring). The CMO Survey: Results by firm characteristics. https://cmosurvey.org/results/
Data Research Analysis. (n.d.). Connect marketing spend to revenue: End the MarTech stack mess. https://www.dataresearchanalysis.com/connect-marketing-spend-to-revenue
Gartner. (2025, May 12). Gartner 2025 CMO spend survey reveals marketing budgets have flatlined at 7.7% of overall company revenue [Press release]. https://www.gartner.com/en/newsroom/press-releases/2025-05-12-gartner-2025-cmo-spend-survey-reveals-marketing-budgets-have-flatlined-at-seven-percent-of-overall-company-revenue
McIntyre, E., Perry, R., & Szafran, J. (2025, October 6). Data story: 2025 Gartner CMO spend survey with multichannel insights. Gartner. https://www.gartner.com/en/documents/7025298
Van Mossevelde, C. (2025, November 18). The ROI reckoning and why CMOs need marketing intelligence in 2026. Funnel Blog. https://funnel.io/blog/roi-of-marketing


