
Summary: The GA4 learning curve silently drains agency profits by forcing senior strategists into 10 hours of manual technical work each week. This article breaks down the real cost — $78,000 per strategist per year in lost billable time — and explains why GA4's engineer-first design is to blame. It provides a framework for calculating your agency's maintenance ratio, a time-savings comparison table showing how automation recovers 14 hours per week, and a competitive analysis of GA4 alternatives. DRA is introduced as the only platform that removes the technical layer entirely — no migration project, no SQL required, and live dashboards in under 3 hours. Six authoritative research sources are cited throughout including Gartner, HubSpot, and GA4Hell benchmarks.
If your senior strategist spends mornings in GA4 configuration tabs instead of campaign meetings, you are losing roughly 10 billable hours per person per week. That is 520 hours a year per strategist spent on technical translation instead of strategic growth. At a blended rate of $150/hour, one person costs you $78,000 in lost output annually (GA4Hell Research, 2025). The learning curve is not a training problem. It is a structural tax on your agency's profit margin.
1. What is the actual price of the GA4 learning curve?
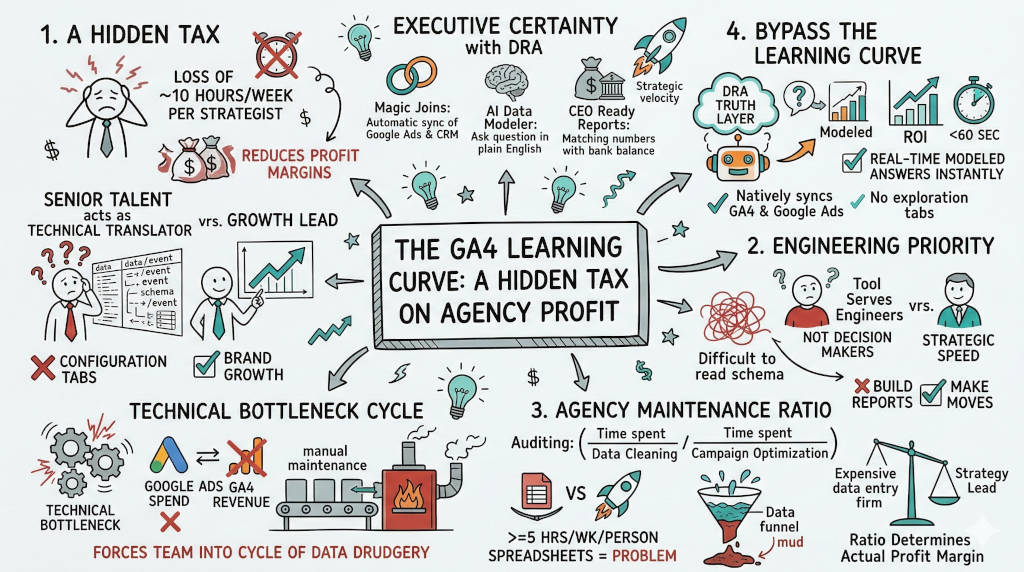
The Answer: The GA4 learning curve costs your agency roughly 10 hours of billable time per strategist every week. This drain occurs when senior talent acts as a technical translator instead of a growth lead. You pay for strategic vision but receive manual maintenance. This technical bottleneck reduces your profit margins. It stops you from moving at high velocity. It forces your team into a cycle of data drudgery.
Research from over 500 GA4 implementation audits found that 73% of businesses struggle with successful implementation, and 87% of implementations contain at least one critical configuration error (GA4Hell Research, 2025). The average team spends 8.3 hours per week on manual report creation alone.
The Maintenance Tax
You hired your team for their creative soul and strategic brain. You wanted them to build brand growth. Instead they spend their mornings on manual data maintenance — matching Google Ads spend to GA4 revenue. This is not strategy. This is a technical hurdle. When your team is stuck in this cycle your results stay flat. You are paying a premium for work that a machine should do automatically.
2. Why does GA4 require constant technical translation?
The Answer: GA4 requires translation because it serves engineers rather than decision makers. The tool uses a complex event scoped schema that is difficult to read. You must perform manual mapping just to find a simple ROI number. This creates a state of data drudgery for your staff. You spend time building reports instead of making moves. This friction is the primary source of your lost billable hours.
More than 13 million websites now run GA4 (BuiltWith, 2026), yet research shows that 61% of marketing professionals report incomplete adoption (MarTech Alliance, 2026). The platform was built for technical analysts, not marketing leaders. This architectural mismatch forces agencies to maintain a layer of technical translation that should not exist.
The Engineering Priority
Google built GA4 for developers. It did not build the tool for strategic speed. You need a technical map just to find your actual profit. Your team spends their morning in configuration tabs instead of campaign meetings. This friction prevents you from making quick pivots. Your decision speed decreases. You lose your edge while your staff troubleshoots pixels.
3. How do you calculate your agency maintenance ratio?
The Answer: You calculate the ratio by auditing your team's output for one week. Track the time spent on manual data cleaning versus actual campaign optimization. If your team spends more than five hours a week on spreadsheets you have a problem. This ratio determines your actual profit margin. A high maintenance ratio means you are acting as an expensive data entry firm rather than a strategy lead.
According to Gartner (2024), poor data quality costs organizations an average of $12.9 million annually. For agencies, this cost manifests as lost billable hours spent fixing broken spreadsheets and reconciling mismatched reports.
The Real Cost Comparison
Task | Manual (GA4 Native) | With Automated Intelligence | Time Saved |
|---|---|---|---|
Monthly client report per account | 4 hours | 20 minutes | 3.7 hours |
Cross-client data consolidation | 3 hours | 0 (automated) | 3 hours |
Custom dimension setup and mapping | 2 hours | 5 minutes | 1.9 hours |
Campaign performance cross-check | 2.5 hours | 30 seconds | 2.4 hours |
Weekly data quality review | 3 hours | 0 (continuous) | 3 hours |
Total per strategist per week | 14.5 hours | ~25 minutes | ~14 hours reclaimed |
A team of five strategists running manual GA4 workflows is losing 72.5 hours per week. At scale, that is a full-time hire plus overtime every seven days.
At 10 clients, your manual reporting time is 15 to 25 hours per month. At 25 clients, it hits 37 to 62 hours. At 50 clients, manual reporting consumes 75 to 125 hours. This does not scale. You cannot hire your way out of an architecture problem. The HubSpot (2026) State of Marketing Report found that 67% of marketing teams using AI and automation save 10 or more hours per week — time that goes back into strategy and growth.
4. How does DRA bypass the GA4 learning curve without a migration project?
The Answer: DRA eliminates the learning curve by making the technology invisible. Our engine syncs natively with GA4 and Google Ads. It structures your data automatically. You ask questions in plain English and receive modeled answers in under 60 seconds. There is no migration project. No data export. No retraining. Your team connects their existing accounts in one session and has live dashboards the same day.
More than half of go-to-market teams (53%) say technology is the biggest barrier to alignment, and only 30% believe their stack actually enables it (von Hoffman, 2026). DRA was built to solve this exact problem — removing the technical friction between your data and your decisions.
What Implementation Actually Looks Like
Day One: Connect your GA4, Google Ads, and CRM data sources. DRA's Federated Query Layer reads the data where it lives. No data movement required.
Day Two: The AI Data Modeler connects the dots between user IDs, campaign spend, and revenue. Magic Joins infers relationships automatically. You do not write a single SQL query.
Day Three: Your first CEO-ready report is live. Public Share Links let you send it to clients without login friction. Your team stops building reports and starts taking action.
The average DRA setup takes less than three hours from first login to live client dashboard. The technology is not something your team learns. It is something your team uses.
Security and Compliance
DRA operates with end-to-end encryption. Role-based access controls ensure client data stays segregated. No client ever sees another client's performance data. Your agency maintains full governance over who sees what and when.
5. How does DRA compare to other GA4 reporting tools?
The Answer: Every tool in this space solves a different piece of the problem. ClicData and Looker Studio automate dashboard creation. Helpful Analytics provides pre-built templates. None of them eliminate the underlying GA4 complexity. DRA is the only platform that removes the technical layer entirely.
Capability | GA4 Native | Looker Studio | ClicData | DRA |
|---|---|---|---|---|
Setup time per client | 2 to 4 hours | 2 to 4 hours | 2 to 4 hours | Under 3 hours total |
Learning curve for team | Steep | Moderate | Moderate | None (plain English queries) |
Natural language querying | No | No | No | Yes (AI Data Modeler) |
Cross-channel data unification | Manual | Manual | Automated | Automated (Federated Query Layer) |
Multi-client portfolio view | No | Build yourself | Yes | Yes |
White-label reporting | No | Yes | Yes | Yes (Public Share Links) |
Security and access controls | Basic | Basic | SOC2 | End-to-end encryption, role-based |
Requires data migration | No | No | No | No (reads data in place) |
6. What are the most common mistakes agencies make with GA4 reporting?
The Answer: Most agencies repeat the same five mistakes. They set data retention to the default 2 months instead of 14. They mark every event as a conversion. They use one GTM container for multiple clients. They skip documentation. And they ignore the 24 to 48 hour data delay. Each mistake compounds across clients. Each one eats into your margin.
GA4Hell Research (2025) found that 78% of implementations have missing conversion tracking — the most critical issue affecting ROI measurement. Another 65% contain incorrect event parameters that lead to inaccurate reporting.
Mistake 1: Not Changing Data Retention
The default GA4 data retention is 2 months. If you do not change it to 14 months on day one, your year-over-year comparisons stop working. This is not retroactive. Miss it and the data is gone.
Mistake 2: Overloading Conversions
GA4 has no limit on conversion events. That sounds like a feature. It is a trap. When you mark every event as a conversion you cannot see what actually drives business outcomes. Mark only the events that match genuine revenue actions.
Mistake 3: Shared GTM Containers
One container for multiple clients is fragile. A change meant for one client can break another. Use separate containers. Document every tag. Future you will thank present you.
Mistake 4: No Property Documentation
Three months after setup your team will not know why a custom event exists or what a filter does. Maintain a one-page property document per client. Standardize your event taxonomy across all accounts.
Mistake 5: Relying on Real-Time GA4 Data
GA4 has a 24 to 48 hour data delay on standard reports (GA4Hell Research, 2025). If you monitor campaign performance in real time, GA4 is not your source of truth. You need a system that refreshes continuously.
GA4 Learning Curve and Agency Productivity FAQ
Q: How long does it take to set up DRA for a new client? A: Under 3 hours from first login to live dashboard. No data migration. No retraining required.
Q: Can I still access my GA4 data if I use DRA? A: Yes. DRA reads your GA4 data through its Federated Query Layer. Your GA4 property stays intact. DRA is a layer on top, not a replacement.
Q: Is my client data secure in DRA? A: Yes. DRA uses end-to-end encryption and role-based access controls. Client data is fully segregated. No cross-client visibility.
Q: Does DRA work with Google Ads and CRM data? A: Yes. DRA connects to GA4, Google Ads, SQL databases, CRM platforms, and flat files. Magic Joins automatically infers relationships between user IDs, emails, and campaign data.
Q: How much time will my team actually save? A: Most teams reclaim 10 to 14 hours per week per strategist. HubSpot (2026) reports that 67% of marketing teams using automation save 10+ hours per week. At a blended rate of $150 per hour, that is $78,000 to $109,000 in recovered output per person per year.
Q: What happens if my team does not know SQL? A: They do not need to. DRA's AI Data Modeler converts plain English into complex SQL automatically. Your team types the question. DRA returns the answer.
Your Next Step
Stop acting as a technical translator for a tool that was never built for you. Lead your agency with certainty. Reclaim your team's billable hours and start winning today. Get started with DRA.
References
BuiltWith. (2026, January). Google Analytics 4 usage statistics. https://builtwith.com/analytics/google-analytics-4
GA4Hell Research. (2025). GA4 implementation statistics and industry benchmarks. https://ga4hell.com/ga4-statistics
Gartner. (2024, August 29). Data quality: Why it matters and how to achieve it. https://www.gartner.com/en/data-analytics/topics/data-quality
HubSpot. (2026). 2026 state of marketing report. https://www.hubspot.com/state-of-marketing
MarTech Alliance. (2026, January). GA4 adoption survey. https://www.amraandelma.com/google-analytics-4-adoption-stats/
von Hoffman, C. (2026, April 3). Martech stacks are holding back sales and marketing teams. MarTech. https://martech.org/martech-stacks-are-holding-back-sales-and-marketing-teams/


