
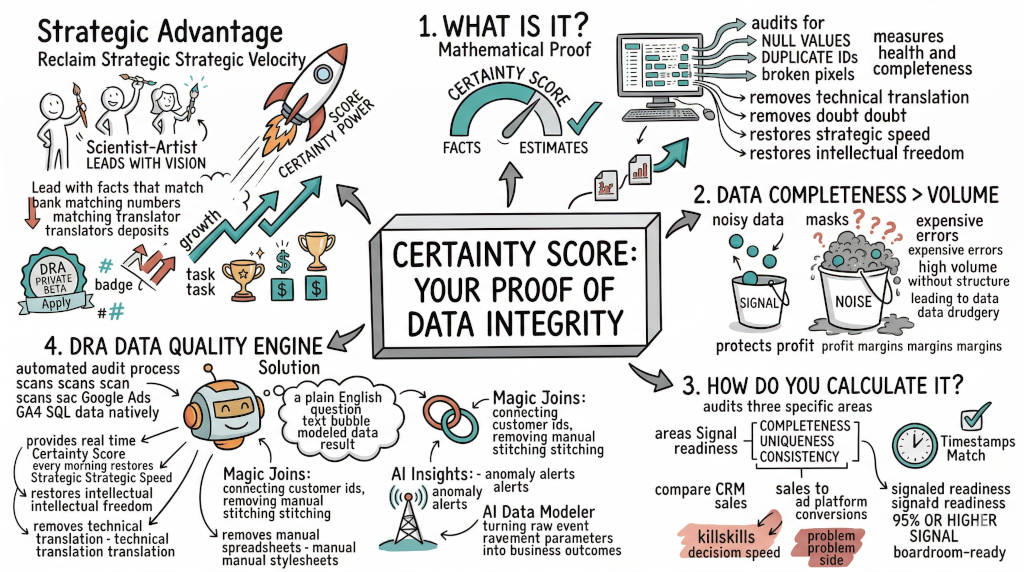
Summary: A Certainty Score proves your marketing data is 98% complete by auditing five dimensions: accuracy, completeness, consistency, timeliness, and uniqueness (ISO, 2015a; ISO, 2015b). This article explains how to calculate it manually, what validation rules prevent errors (Tricentis, 2026), why GA4's 24-48 hour lag and sampling make it unreliable for boardroom decisions (Google, n.d.-a; Google, n.d.-b), and how DRA's Data Quality Engine automates continuous certainty monitoring. Teams that automate these checks catch errors in hours instead of months (Lowerplane, 2026) and reclaim weeks of analyst time lost to manual validation (Salesforce Datorama, 2019; Treasure Data, 2022).
You are making budget decisions on dashboards your CFO does not trust. Every report that lands on your desk carries hidden errors: duplicated conversions, missing UTMs, stale data that does not match the bank account. A Certainty Score changes that. It proves your data is 98% complete before the report reaches the boardroom. Here is how to build one and why DRA is the only platform that delivers it at scale.
1. What is a Certainty Score and why should it matter to a CMO?
The Answer: A Certainty Score is a single number that measures the health of your marketing data before it enters a report. It audits completeness, uniqueness, and consistency across every data stream. A score of 95% or higher means your boardroom numbers match your bank deposits. Anything lower means you are spending budget on signals that have not been proven accurate.
Most CMOs operate in the dark. Your GA4 dashboard shows conversions. Your CRM shows revenue. The two never match. You assume the gap is normal because it has always been there. It is not normal. It is a leak in your strategic velocity.
The cost is not just misallocated spend. It is the meeting where your CFO asks why the numbers do not hold up. It is the quarter you cannot prove your team's impact — the exact moment you need to prove marketing ROI with data your leadership trusts. It is the trust deficit that turns every budget pitch into a defensive exercise.
The Real Cost of Incomplete Data
A marketing team managing $5M in annual ad spend with 10% data incompleteness is making decisions on $500,000 of phantom budget. That is not a rounding error. That is a competitive disadvantage. Your competitor who can prove 98% data certainty moves faster because they trust their numbers. You cannot.
2. What are the dimensions of data quality every executive must know?
The Answer: Data certainty rests on five measurable dimensions: accuracy, completeness, consistency, timeliness, and uniqueness. ISO 25024 defines quantifiable targets for each (International Organization for Standardization [ISO], 2015a). A Certainty Score aggregates these dimensions into one number you can monitor daily. ISO 8000 adds semantic correctness — your data must mean the same thing across every system (ISO, 2015b).
Here is how these dimensions break down in practice:
Dimension | What it means | What failure looks like |
|---|---|---|
Accuracy | Data matches real-world events | A conversion fires twice for one purchase |
Completeness | Every required field is present | A session has no campaign source |
Consistency | Values agree across all systems | "Google Ads" in one tool, "google/cpc" in another |
Timeliness | Data arrives when you need it | Yesterday's spend shows up on Thursday |
Uniqueness | No duplicate records | The same order counted twice in revenue |
The CMO problem is not technical. It is trust. When you cannot guarantee these five dimensions, you cannot walk into a board meeting with confidence. You walk in with estimates.
Why GA4 Fails at This
GA4 was built for engineers. It samples data on high-traffic properties (Google, n.d.-b). It applies default channel grouping that hides your real traffic sources. It delivers reports with a 24-to-48-hour lag (Google, n.d.-a). None of these are bugs — they are architectural choices that serve Google's needs, not yours. A CMO relying on GA4 for decision-grade data is relying on a system optimized for ad sales, not executive certainty.
3. How do you calculate data certainty across your marketing stack?
The Answer: You audit three areas. Completeness: does every conversion event carry a source, medium, and campaign ID? Uniqueness: are there duplicate order IDs inflating your revenue? Consistency: do your CRM timestamps match your ad platform timestamps? A DRA Certainty Score runs these checks across your entire stack in seconds. Doing it manually takes a team of analysts three days.
Here is the manual process — run it once to understand the gap, then automate it with DRA:
Completeness Audit: Export your last 30 days of conversion data. Count rows where campaign_id, source, or medium is null. If nulls exceed 2% of total rows, your certainty score drops below 98%.
Uniqueness Audit: Run a COUNT DISTINCT on your transaction IDs against the total row count. If they differ, you have duplicates inflating your metrics. A single duplicate order ID in a revenue report can overstate ROI by thousands of dollars.
Consistency Audit: Compare your CRM close dates to your ad platform conversion timestamps. If they differ by more than 24 hours for the same event, your attribution model is breaking. Most teams discover this during quarterly reviews — three months after the data was corrupted.
Cross-Source Reconciliation: Pull total spend from Google Ads UI. Compare it to spend in your data warehouse. A variance above 2% means something broke during extraction or transformation.
The math is simple: (Clean Records / Total Records) × 100 = Your Certainty Score. A score above 95% means your data is boardroom-ready. A score below 90% means you are making decisions on noise.
The 48-Hour Problem
Most marketing analytics platforms deliver reports with a 48-hour lag (Google, n.d.-a). That means every Tuesday morning you are reviewing Thursday's data. If a campaign went off the rails on Monday, you catch it Wednesday. That is four days of wasted ad spend before you know anything is wrong. A Certainty Score on fresh data — refreshed daily or in real time — eliminates this delay. DRA refreshes your data on the schedule your business needs, not the schedule your analytics vendor dictates.
4. What validation rules and governance frameworks prevent data errors?
The Answer: Four constraint types stop data errors at the source. NOT NULL prevents missing fields. UNIQUE stops duplicates. CHECK validates ranges and formats. Schema validation confirms structure before ingestion. These rules must be enforced as code, not as manual checklists (Tricentis, 2026). DRA's Data Quality Engine applies these rules automatically across every connected data source.
More than half of GTM teams (53%) say technology is the biggest barrier to alignment, and only 30% believe their stack enables it (von Hoffman, 2026). When your tools do not connect, your team cannot move fast. DRA eliminates that friction.
UTM drift: A campaign launches with correct parameters. A junior marketer shares the link without UTMs. Two weeks later, 15% of traffic lands in "Direct/(none)." Your attribution model breaks silently.
Schema changes: Google Ads updates its API. A field you depend on changes from a string to an integer. Your pipeline fails or coerces the value incorrectly. Your spend data corrupts.
Time zone mismatches: Your ad platform runs on Pacific time. Your CRM runs on Eastern. Your warehouse stores everything in UTC. Every time boundary creates a data gap that compounds over weeks.
Validation rules catch these errors at the point of entry — not three months later during a quarterly audit.
Why Manual Validation Is a Leadership Failure
If your marketing operations team spends Fridays running manual checks on data freshness, they are doing work that should be automated. The Datorama benchmark across 1,100 organizations found marketers waste a minimum of 3.55 hours per week on manual data management — 8 hours per week is conservative for teams managing five or more platforms (Salesforce Datorama, 2019). The Treasure Data survey found teams spend an average of 14.5 hours per week on data collection alone (Treasure Data, 2022). DRA runs these checks automatically. Your team gets those hours back for strategy, campaign optimization, and growth work.
5. How do you implement multi-layer testing for marketing data?
The Answer: Data quality testing must happen at three layers. Ingestion: validate raw data as it arrives from ad platforms. Transformation: verify joins and aggregations produce correct outputs. Publication: confirm the final dataset matches source platform totals before it reaches your dashboard. DRA validates at all three layers automatically.
Layer 1 — Ingestion: When Google Ads pushes daily spend data, DRA checks every row for schema compliance. If a field is missing or misformatted, the system flags it before the write completes. This catches API changes the moment they happen, not when an analyst notices the dashboard looks wrong.
Layer 2 — Transformation: When data moves from raw tables to modeled reporting tables, DRA validates referential integrity. Every session ID in your events table must have a matching record in your sessions table. A broken join here produces incorrect metrics in every downstream report.
Layer 3 — Publication: Before data loads into your dashboard, DRA reconciles totals against source platforms. If your warehouse shows $50K in Google Ads spend but Google reports $51.5K, the system alerts your team. You decide whether to proceed with a known gap or pause until the discrepancy is resolved.
The Difference Between Audits and Assurance
A quarterly data audit finds problems that have been silently corrupting reports for 90 days. Continuous monitoring — DRA's approach — finds the same problems within hours. The choice is not about rigor. It is about speed. Organizations using continuous monitoring report up to 60% faster detection and 40% fewer compliance gaps than those relying on point-in-time audits (Lowerplane, 2026). Your competitors using continuous monitoring catch more data errors per quarter because the detection lag is hours instead of months.
6. How does the DRA Data Quality Engine deliver executive certainty?
The Answer: DRA automates the entire Certainty Score calculation across your Google Ads, GA4, Meta, and CRM data. Our Federated Query Layer joins data where it lives — no extraction required. The AI Data Modeler translates your questions into precise SQL. You see a real-time Certainty Score for every dashboard. You walk into board meetings with numbers your CFO can verify independently.
DRA delivers three capabilities no other marketing intelligence platform offers:
The Federated Query Layer. Most platforms force you to move your data into their warehouse. DRA queries your data where it lives — in BigQuery, Snowflake, PostgreSQL, or any SQL source. This eliminates the extraction step where most data corruption occurs. Your data stays in your control. DRA just makes it trustworthy.
The AI Data Modeler. Built on Gemini 2.0, this converts plain English into complex SQL. You ask "What was my ROAS for Facebook prospecting campaigns last week?" The modeler builds the join, applies the filter, and returns the answer. No SQL required. No waiting for an analyst.
5-Model Attribution. DRA runs five attribution models simultaneously — First-Touch, Last-Touch, Linear, Time-Decay, and U-Shaped. You see exactly how each model values your channels. If your data is incomplete, the Certainty Score flags it before you make budget decisions based on flawed attribution.
What 98% Certainty Unlocks
When you can prove your data is 98% complete before reporting, three things change:
Budget confidence. You scale winning channels without wondering if the data is real.
Executive trust. Your CFO stops asking for validation. The numbers match the bank account.
Strategic velocity. You make decisions on today's data, not last week's estimates.
7. How do you know if your data certainty is at risk?
The Answer: Five warning signs tell you your data certainty is below 95%. Your dashboard spend does not match your ad platform totals. You see a high percentage of "Direct/(none)" in GA4. Your conversion rates fluctuate more than 20% week over week with no campaign change. Your analysts spend Fridays running manual checks. Your CFO asks for "backup numbers" before every budget meeting.
Each of these signals points to a specific root cause:
Warning Sign | Likely Root Cause | Fix |
|---|---|---|
Dashboard != Platform totals | Extraction failure or missing fields | Validate at ingestion |
20%+ "Direct/(none)" traffic | Missing UTMs on paid campaigns | Enforce UTM taxonomy at the URL builder level |
Wild conversion swings | Duplicate events or broken joins | Run uniqueness and referential integrity checks |
Manual validation Fridays | No automated quality checks | Deploy DRA's Data Quality Engine |
CFO wants backup numbers | Trust deficit from past inaccuracies | Provide a public Certainty Score link showing 98%+ |
When to Stop the Report
If your Certainty Score drops below 90%, stop the report. Do not present numbers you cannot defend. A delay with a clear explanation preserves trust. A confident number that turns out to be wrong destroys trust that takes months to rebuild.
FAQ
Q: Can I calculate a Certainty Score without buying software? A: Yes. Run the four audit steps in section 3 manually. You will get a snapshot. But manual audits cannot run daily, and they miss the errors that happen between checks. DRA automates the continuous version.
Q: How often should I check my Certainty Score? A: Every morning before you make budget decisions. DRA delivers a fresh score on every data refresh. Manual checks cannot match this cadence.
Q: What threshold triggers a report stop? A: Any score below 90% is a boardroom risk. Between 90% and 95%, fix the issues before the next report. Above 95%, proceed with confidence.
Q: Does a high Certainty Score guarantee higher ROI? A: No. It guarantees your ROI calculations are accurate. That is the prerequisite for making good budget decisions. You cannot optimize what you cannot measure correctly.
Q: What about GA4's data sampling? A: GA4 samples data on high-traffic properties. A Certainty Score built on sampled data is unreliable. DRA queries your raw data directly — no sampling, no estimates, no "directionally correct" numbers.
Q: How does DRA differ from data observability tools like Monte Carlo or Soda? A: Those tools are built for data engineering teams. They validate infrastructure. DRA is built for marketing leaders. It validates campaign data, attribution models, and revenue reporting. It speaks your language, not SQL.
CTA
Prove your data is 98% complete before your next board meeting. Start your DRA plan today.
References
Data Research Analysis. (2026). The invisible drain: Is your marketing team losing 400 hours a year to "data drudgery"? https://www.dataresearchanalysis.com/articles/the-invisible-drain-is-your-marketing-team-losing-400-hours-a-year-to-data-drudgery
Google. (n.d.-a). [GA4] Data freshness and Service Level Agreement constraints. Google Analytics Help. https://support.google.com/analytics/answer/12233314
Google. (n.d.-b). [GA4] Understand how Analytics stores and displays data. Google Analytics Help. https://support.google.com/analytics/answer/13888627
International Organization for Standardization. (2015a). ISO/IEC 25024:2015 — Systems and software engineering — Systems and software Quality Requirements and Evaluation (SQuaRE) — Measurement of data quality. https://www.iso.org/standard/35749.html
International Organization for Standardization. (2015b). ISO 8000-8:2015 — Data quality — Part 8: Information and data quality: Concepts and measuring. https://www.iso.org/standard/60805.html
Lowerplane. (2026). Continuous monitoring vs point-in-time audits: Why real-time compliance wins. https://lowerplane.com/blog/continuous-monitoring-vs-audits/
McKinsey Global Institute. (2012, July). The social economy: Unlocking value and productivity through social technologies. McKinsey & Company. https://www.mckinsey.com/industries/technology-media-and-telecommunications/our-insights/the-social-economy
Salesforce Datorama. (2019). Marketing intelligence report: Data, growth, and the new marketing mandate. https://www.salesforce.com/wbin/sfdc-www/autodownloadpdf?path=%2F%2Fwww.salesforce.com%2Fcontent%2Fdam%2Fweb%2Fen_us%2Fwww%2Fdocuments%2Fe-books%2Fmarketing%2Fmarketing-intelligence-report.pdf
Treasure Data. (2022). It's time to get efficient with your customer data. CDP.com. https://cdp.com/articles/data-efficiency-marketing-study/
Tricentis. (2026). What is data validation? Methods and examples. https://www.tricentis.com/learn/data-validation
von Hoffman, C. (2026, April 3). Martech stacks are holding back sales and marketing teams. MarTech. https://martech.org/martech-stacks-are-holding-back-sales-and-marketing-teams/