Last Updated: May 1, 2026
Summary: Last touch gives full credit to the final click. Google states this directly. That model can hide early channel contribution. Teams then cut awareness spend too early. The fix is attribution parity. Compare models side by side. Add a lag check. Use transparent math before cutting budget. This rewrite corrects weak claims and keeps only defensible numbers.
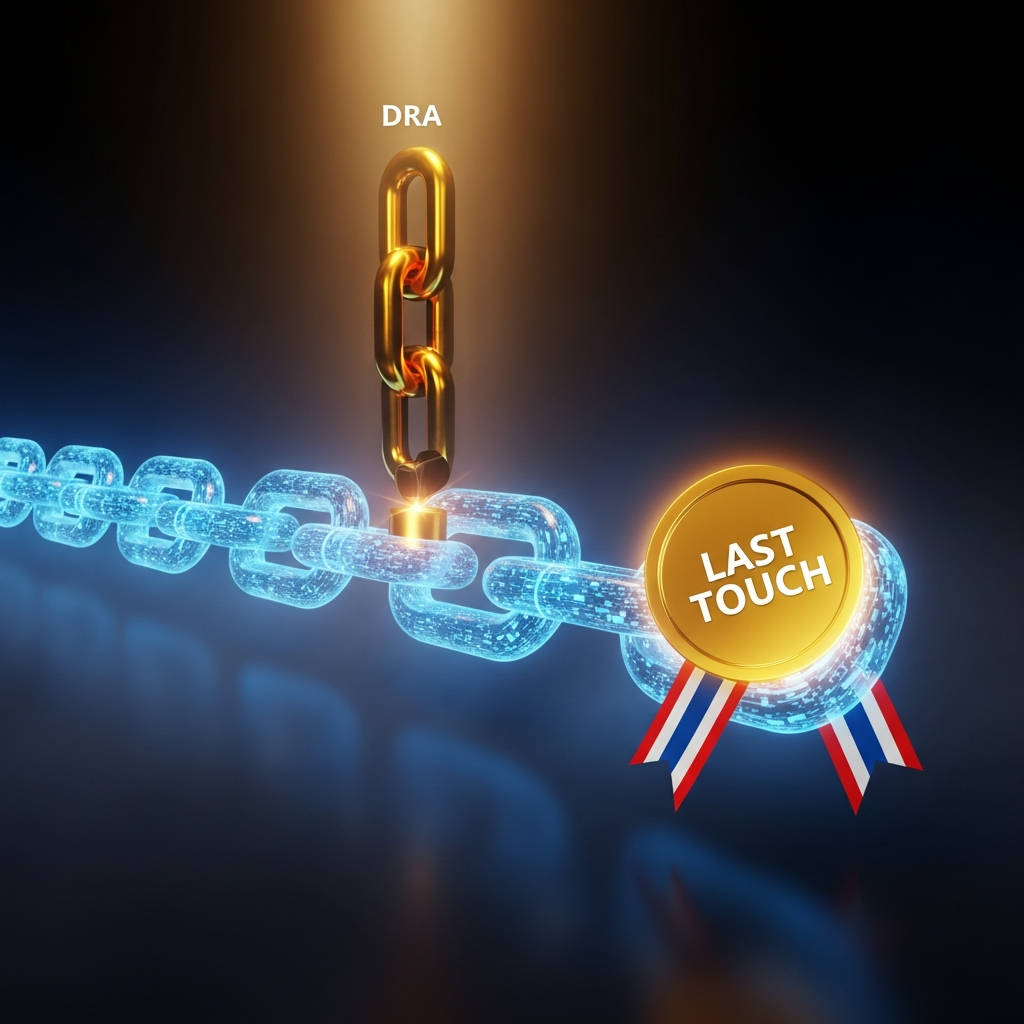
1. What is last touch attribution bias?
The Answer: Last touch bias happens when one final interaction gets all conversion credit. Google Ads and GA4 both document this behavior for last click models. This can overvalue closers, like branded search, and undervalue starters, like awareness campaigns. The result is not just reporting bias. It becomes a budget allocation risk.
Why this matters for executive decisions
Google Ads states that last click gives all credit to the last clicked ad and keyword.
GA4 also defines paid and organic last click as 100 percent credit to the final channel before conversion.
If the board sees only that model, channel cuts can target the wrong budget line.
2. Why can last touch become a 50,000 dollar scale mistake?
The Answer: The 50,000 dollar mistake is a budgeting error pattern. It is not a universal benchmark. You cut 50,000 dollars from awareness because last touch shows weak direct conversions. Two weeks later, lower funnel volume drops. Your apparent savings become a pipeline loss. The mistake is not spend size. It is attribution blindness.
Corrected math with explicit assumptions
Use this scenario. Keep assumptions visible.
Awareness budget to cut: 50,000 dollars per month.
Blended contribution margin after media: 300 dollars per new customer.
Expected lost customers from reduced top funnel inputs: 200 in the next cycle.
Margin loss: 200 times 300 equals 60,000 dollars.
Net effect: you save 50,000 dollars in media but lose 60,000 dollars in margin.
Estimated net damage: 10,000 dollars for that cycle.
This is why the error scales quickly at larger budgets.
3. How do you verify whether awareness is actually assisting conversion?
The Answer: Use model comparison, not one model. Google Ads recommends comparing last click against data driven attribution to find undervalued campaigns and keywords. GA4 also supports cross channel attribution views. If rankings change across models, your spend decisions need a parity review before any cuts.
Practical verification workflow
Pull last click and data driven reports for the same date window.
Compare campaign rank shifts, not only total conversions.
Flag channels that drop hard under last click only.
Freeze budget cuts until the parity check is complete.
If a channel drives assisted paths, last touch will usually understate it.
4. How many hours can attribution cleanup consume each year?
The Answer: A conservative planning baseline is 400 hours per year per analyst for manual data work. The math is simple: 8 hours per week across 50 working weeks. McKinsey also reports knowledge workers spend about 19 percent of time finding information. Both signals support a material time tax before strategy work begins.
Consistent hours model across related DRA articles
Baseline formula: 8 hours times 50 weeks equals 400 hours yearly.
Team impact examples:
This keeps your hour model consistent with the revised Invisible Drain pieces.
5. What is the payroll value of those lost hours?
The Answer: Payroll impact depends on loaded hourly cost. Use a transparent range. At 60 dollars per hour, 400 hours cost 24,000 dollars. At 100 dollars per hour, 400 hours cost 40,000 dollars. For senior analysts, loaded cost can be higher. BLS shows benefits are a major share of employer compensation.
Corrected compensation framing
BLS reports private industry benefits at 29.9 percent of total compensation.
Conservative loaded estimate:
If base pay is 150,000 dollars and benefits plus taxes are about 30 percent of salary, loaded cost is about 195,000 dollars.
Share of total method using BLS split:
150,000 divided by 0.701 equals about 214,000 dollars total compensation equivalent.
Both methods show that base salary understates real cost.
6. What should replace last touch only reporting?
The Answer: Replace single model reporting with attribution parity controls. Keep one executive view. Include at least last click and data driven comparison. Add lag monitoring so you do not mistake delayed effects for channel failure. GA4 data freshness notes that processing can take 24 to 48 hours. Decision speed requires this context.
Minimum parity standard for weekly leadership reviews
Two model comparison table: last click and data driven.
Assisted conversion check for top funnel campaigns.
Seven day lag watch before major channel cuts.
Budget change log tied to conversion and margin outcomes.
This process reduces false negatives in awareness channels.
FAQ
Q: Is the 50,000 dollar mistake a proven industry average? A: No. It is a scenario amount. The pattern is real. The value depends on your margin and conversion volume.
Q: Should we remove last touch entirely? A: No. Keep it as one lens. Do not use it as the only budget authority.
Q: Why do report disagreements happen week to week? A: GA4 notes processing and attribution updates can change reported values after initial publication.
Q: Can we still use old position based models in GA4? A: No. Google states first click, linear, time decay, and position based models were deprecated.
Q: What is the first operational step this week? A: Run a last click versus data driven comparison before your next budget reallocation.
#MarketingStrategy #Attribution #CMO #DataIntelligence #ROI #MarTech #DRA #StrategicVelocity #GA4
References
Google Ads Help. About attribution models. https://support.google.com/google-ads/answer/6259715
Google Analytics Help. Get started with attribution. https://support.google.com/analytics/answer/10596866
Google Analytics Help. Select attribution settings. https://support.google.com/analytics/answer/10597962
Google Analytics Help. GA4 data freshness. https://support.google.com/analytics/answer/11198161
U.S. Bureau of Labor Statistics. Employer Costs for Employee Compensation. https://www.bls.gov/news.release/ecec.nr0.htm
McKinsey Global Institute. The social economy. https://www.mckinsey.com/industries/technology-media-and-telecommunications/our-insights/the-social-economy