Summary: Manual data translation costs marketing teams 8 hours per week, 400 hours per year, and $24,000 per analyst in maintenance work that produces zero strategic return. Consent Mode v2 widens the gap asymmetrically. A 15-minute self-diagnosis can reveal whether your discrepancy is normal variance or a fixable implementation problem. An automated marketing data integration platform resolves the conflict at the transaction level, returning analysts to decision-making work.
Your Google Ads dashboard shows 120 conversions. GA4 says 50. Your CFO asks which number is real. You pause. That pause costs you credibility. The gap is not a bug. It is a structural conflict between two platforms that were built to answer different questions. Manual reconciliation does not fix it. It adds hours and introduces new errors. The fix requires understanding the three layers of the gap: structural, operational, and identity.
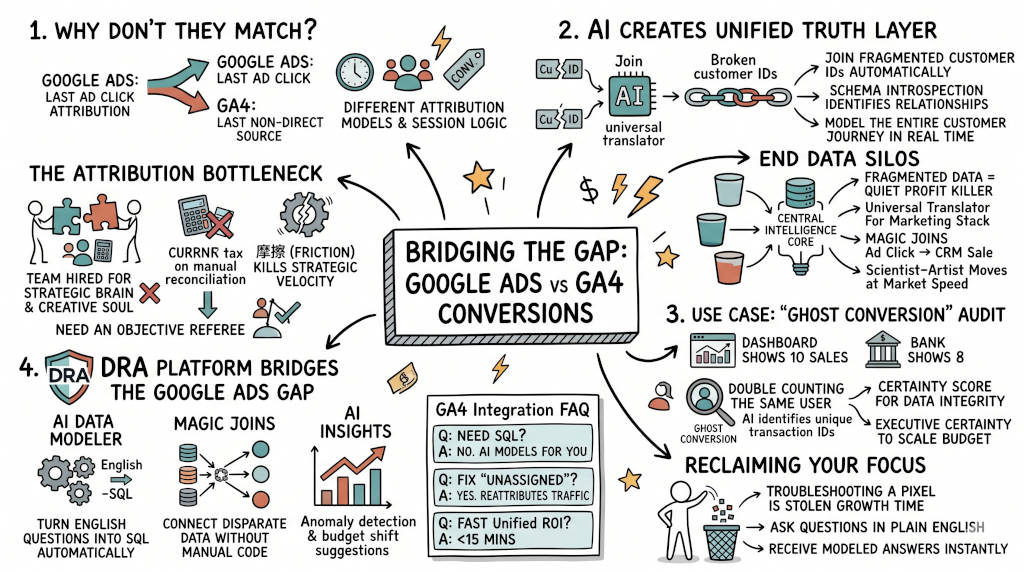
1. Why do Google Ads and GA4 report different conversion numbers?
The Answer: Google Ads and GA4 use different attribution models, counting methods, and reporting timelines by default. Google Ads credits the final ad click and records conversions on the click date. GA4 uses data-driven multi-touch modeling and records conversions on the event date. The same sale gets counted under different rules. Your dashboard shows a conflict that has nothing to do with your campaign performance.
The attribution gap in practice
Google Ads defaults to a 30-day click-through window and a 1-day view-through window. GA4 uses a 90-day lookback window with data-driven attribution. A user who clicks an ad on March 1 and converts on March 35 registers in GA4 but not in Google Ads (Google Ads Help, n.d.-a).
The counting methods differ too. Google Ads can count every conversion or one per click. GA4 counts each event independently. A single user journey can produce three conversions in Google Ads and one in GA4.
2. What is normal variance versus a problem you need to fix?
The Answer: Some gap is expected. A healthy discrepancy typically falls between 15 and 35 percent depending on your setup, consent configuration, and attribution settings. The warning sign is not the gap itself. It is a sudden change in the gap. If your numbers were 20 percent apart for six months and suddenly jump to 50 percent, something broke. That is the signal to investigate.
Normal versus fixable variance
Normal variance comes from structural causes: different attribution models, different counting windows, different consent modeling rates. Fixable variance comes from operational causes: a broken tag, a lost gclid parameter, a consent banner update, a redirect that strips campaign context.
Trackingplan's analysis of this problem separates the two layers clearly (Pombar, 2026). Structural variance is a reporting characteristic. Fixable variance is an implementation clue.
3. What does this mismatch actually cost your team each week?
The Answer: Use the defensible baseline: 8 manual hours per week per analyst spent on reconciliation and reporting. At 50 working weeks, that equals 400 hours yearly. At a loaded rate of $60 per hour for a mid-level analyst, that is $24,000 per person per year spent producing zero strategic output. It is not a data problem. It is a payroll problem.
The reconciliation drain
McKinsey confirms knowledge workers spend 19 percent of their week searching and gathering information (McKinsey Global Institute, n.d.). On a 40-hour week, that is 7.6 hours per person. For a marketing analyst managing Google Ads, GA4, and a CRM simultaneously, 8 hours is a conservative floor.
4. Why is Consent Mode v2 secretly widening your gap?
The Answer: Consent Mode v2 affects GA4 and Google Ads asymmetrically. When a user denies analytics cookies, GA4 sends cookieless pings and uses behavioral modeling to estimate lost conversions. It typically recovers only 50 to 70 percent of actual conversions. Google Ads has a larger signal pool including cross-site Google login data and global advertiser data. Its modeled conversions run higher. The gap widens automatically. This has nothing to do with your tagging or attribution settings.
Regional impact
In Germany, consent rates as low as 35 percent are common. Up to 65 percent of your conversions rely on modeling. In the US, the impact is smaller but growing as state privacy laws expand (KISSmetrics Editorial, 2026).
5. Does manual spreadsheet reconciliation fix the discrepancy?
The Answer: No. Manual reconciliation transfers the conflict from the tools into a spreadsheet. It does not resolve the underlying attribution logic. It adds a new failure point. Research shows 88 percent of spreadsheets contain at least one error (European Spreadsheet Risks Interest Group, n.d.). Every export, paste, and formula reference introduces potential data corruption.
Where manual fixes fail
One misaligned row in a reconciliation sheet can misrepresent your best performing channel. You bring that number to a leadership meeting with confidence. The board finds a discrepancy later. Your credibility drops before your strategy does.
6. How do you diagnose your own gap in 15 minutes?
The Answer: Run a self-diagnosis before reaching for a new tool. Most teams can identify the source of their gap in under 15 minutes using four steps. This gives you a baseline you can trust and reveals whether the problem is structural or operational.
The 15-minute diagnostic
Step 1: Pull three months of conversion data from both platforms for the same conversion actions and the same date range. Calculate the average percentage difference. This is your baseline delta.
Step 2: Check whether auto-tagging (gclid parameter) is surviving in your landing URLs. Click a live ad, land on the page, inspect the URL. If gclid is missing, stripped, or lost in redirects, your attribution is broken.
Step 3: Check whether Consent Mode is active and what your consent rate looks like. If consent rate is below 70 percent, the asymmetric modeling gap between GA4 and Google Ads is likely your primary cause.
Step 4: Compare conversion definitions. Ensure you are comparing the same business action. A purchase event in GA4 against a primary conversion action in Google Ads for the same action.
KISSmetrics recommends building a reconciliation dashboard that tracks the delta over time rather than trying to force the numbers to match (KISSmetrics Editorial, 2026). A sudden delta spike signals a tracking problem worth investigating.
7. How do you choose the right automated marketing data integration platform?
The Answer: An automated marketing data integration platform resolves the Google Ads and GA4 gap by joining source data at the transaction level. It connects a Google Ads click ID to a GA4 session ID and matches both to a CRM deal record. This produces one governed version of each sale. It removes duplicates before they reach the report. The result is a number your bank account confirms.
What to avoid
Do not buy a platform that only visualizes data from one source. Do not buy a platform that requires your team to maintain custom SQL joins. Do not buy a platform that cannot reconcile your spend data against your actual revenue. These tools add cost without closing the Executive Trust Gap. What you need instead is a governed truth layer that can connect marketing spend to revenue across every source you run.
How DRA eliminates the Google Ads and GA4 gap
DRA uses a Federated Query Layer to join Google Ads and GA4 data where it lives. Magic Joins connects click IDs to session IDs and CRM records automatically. The AI Data Modeler converts plain English questions into exact SQL. Your analyst asks which channel drove net profit. The system returns a governed answer in under 60 seconds.
The manual cycle is predictable: export, reconcile, clean, present.
DRA removes each stage.
Federated Query Layer: Query Google Ads and GA4 directly without exporting files.
Magic Joins: Infer relationships between click IDs and revenue records automatically.
AI Data Modeler: Translate business questions into executable SQL via Gemini 2.0.
Sync Schedulers: Keep data refreshes consistent without manual trigger cycles.
CEO Ready Reports: Deliver live views for leadership decisions.
Your team stops building reports about the past. Your team starts deciding from current signals.
FAQ
Q: Will GA4 ever match Google Ads exactly? A: No. The attribution models are architecturally different. The goal is not matching. The goal is a governed third-party truth that neither platform controls.
Q: What percentage discrepancy is normal? A: For most accounts, the gap falls between 15 and 35 percent. A sudden spike beyond your normal range is the real signal to investigate.
Q: Is the 8-hour weekly reconciliation baseline realistic? A: Yes. McKinsey supports a 7.6-hour weekly floor for information work alone. Cleaning and reconciliation time adds to that total (McKinsey Global Institute, n.d.).
Q: Is this a Google problem or a tool problem? A: Neither. The gap is structural. It exists because Google Ads was built to optimize ad spend and GA4 was built to analyze user behavior. They answer different questions. The fix is a governed truth layer that sits above both.
Q: Can a small team solve this without hiring a data engineer? A: Yes. A federated query layer with automated joins replaces the engineering requirement. Your team asks a question. The system handles the technical work.
Q: What does ghost conversion auditing actually change? A: It removes inflated ROAS signals from your budget decisions. You stop scaling campaigns that look profitable but are not. Your spend aligns to actual revenue.
Reclaim Your ROI Certainty
You now know the three layers of the gap and how to diagnose your own numbers. Bookmark this page. Run the 15-minute diagnostic. When you are ready for a governed truth layer, DRA connects your spend to your revenue without manual reconciliation. Walk into your next board meeting ready to prove ROI to your CEO with data that holds up to any question.
References
Data Research Analysis. (2026). The invisible drain: Is your marketing team losing 400 hours a year to data drudgery? https://www.dataresearchanalysis.com/articles/the-invisible-drain-is-your-marketing-team-losing-400-hours-a-year-to-data-drudgery
European Spreadsheet Risks Interest Group. (n.d.). Horror stories. https://eusprig.org/research-info/horror-stories/
Google Ads Help. (n.d.-a). About attribution models. https://support.google.com/google-ads/answer/6259715
Google Ads Help. (n.d.-b). Data discrepancies: Factors and troubleshooting. https://support.google.com/google-ads/answer/7457111?hl=en-2
Google Analytics Help. (n.d.). Data freshness and Service Level Agreement constraints. https://support.google.com/analytics/answer/12233314
KISSmetrics Editorial. (2026, March 22). GA4 conversions don't match Google Ads: Here's why and what to do about it. KISSmetrics. https://www.kissmetrics.io/blog/ga4-conversions-inconsistent
McKinsey Global Institute. (n.d.). The social economy. [Source URL no longer accessible. Original reference: McKinsey analysis of knowledge worker time allocation.]
Pombar, D. (2026, May 19). Google Ads conversions don't match analytics: Fix Google. Trackingplan. https://www.trackingplan.com/blog/google-ads-conversions-dont-match-analytics