
Summary: Marketing teams running 14+ disconnected tools lose three hours per leader per day to manual data reconciliation. This structural drag costs mid-market firms $150,000 to $300,000 annually in overlapping tool licenses while forcing strategists into data-entry roles. Competitors with streamlined stacks spend 29% less on technology and achieve better outcomes. The fix is not another platform. It is a unified data layer that connects existing tools, standardizes measurement, and restores strategic velocity. This article diagnoses the five signs of tool overload, explains the four root causes of fragmentation, and delivers a three-week action plan for CMOs to present to their CEO and CFO.
The cost of inaction: Your team has 14 tools. None of them talk to each other. Your CMO spends three hours a day reconciling data from GA4, your CRM, and ad platforms instead of making decisions. Gartner found that 53% of marketing leaders see their own tools as a barrier to alignment (Gartner, 2025). Forrester reports that teams spend 33 hours per month — nearly a full work week — just reconciling conflicting reports (Forrester, 2025). You are not running a tech stack. You are running a data translation agency that happens to be attached to a marketing team. The gap between what your dashboards show and what your P&L says is not a reporting error. It is a structural drag that compounds every quarter.
1. Why does a larger marketing stack make your team slower, not faster?
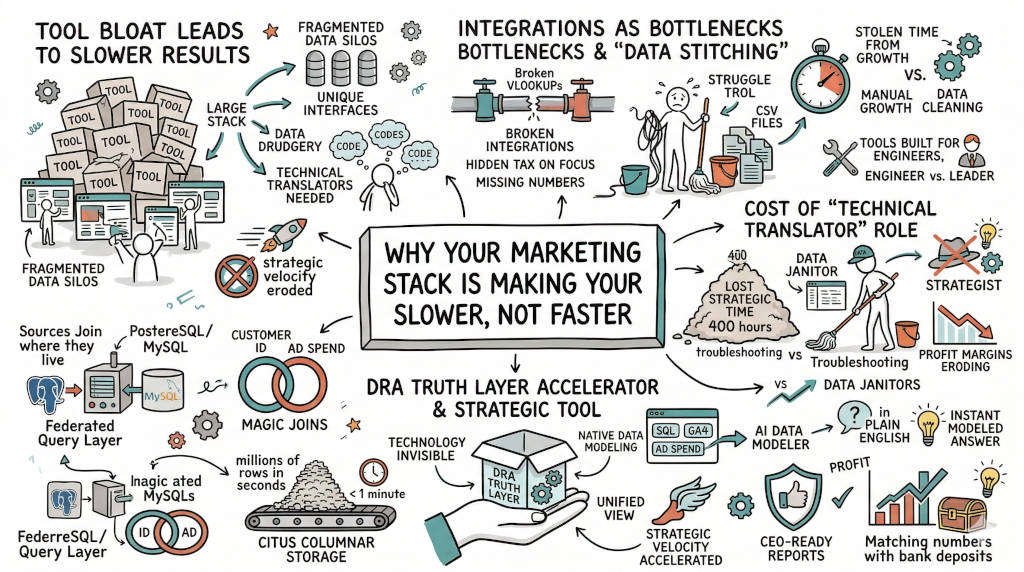
The Answer: Each new tool adds a separate interface, a separate data structure, and a separate definition of success. Your team does not get faster. They become technical translators between platforms that were never designed to work together. The average enterprise uses 120+ marketing technologies, but most teams actively use only 40% of the features they pay for (Productiv, 2025). The other 60% is cost without output.
The hidden math of tool bloat
Forrester found that employees switch between 9.5 applications per day, spending 1.25 hours just navigating between tools (Forrester, 2025). That is six hours per week of lost productivity per employee. For a team of 10, that is 60 hours per week — 1.5 full-time salaries spent on context switching. McKinsey confirms that companies with fragmented tech stacks spend 29% more on technology while achieving less business impact than streamlined competitors (McKinsey, 2025).
What to say to your CEO: "We are paying a 29% premium on our technology budget for worse outcomes. Every tool we add increases complexity faster than it increases capability."
2. How does tool fragmentation create a technical bottleneck?
The Answer: Standard integrations move raw files but do not model the truth. A native connector between GA4 and your CRM may pass data, but it does not reconcile conflicting attribution windows, conversion definitions, or campaign taxonomies. The bottleneck is not the data pipe. It is the translation layer your team has to build and maintain manually.
The price of data stitching
Gartner estimates that organizations waste up to 30% of SaaS spend on improper license management, duplicate tools, and unused features (Gartner, 2024). The Data Warehousing Institute puts the cost of data quality problems at over $500 billion annually for U.S. businesses (TDWI, 2023). The average mid-market marketing team burns $150,000 to $300,000 per year on tools with overlapping features while simultaneously losing 10-20 hours per week to manual data reconciliation.
What to say to your CFO: "We are spending $X on tools that force our best people to do data entry. Every hour they spend fixing integrations is an hour they are not optimizing spend."
3. What are the real causes of marketing stack fragmentation?
The Answer: Fragmentation rarely happens because of one bad decision. It accumulates. A team adds a tool to fix reporting, another to automate email, another to manage paid media, another to improve attribution. Each decision makes sense in isolation. The problem appears later, when those tools do not share the same data structure, measurement logic, or business goal.
The four causes you can fix today
Tool-first decisions. Marketing teams solve problems by buying software instead of by fixing process. The 2025 State of Your Stack Survey found 62.1% of teams use more martech tools than two years ago, while 65.7% say data integration is their biggest challenge (Martech.org, 2025). Teams are adding tools faster than they are connecting them.
Point-to-point integrations that do not scale. A connector between your CRM and email platform works until you add a CDP, a DSP, a retail media platform, and a CTV partner. Each connection has its own fields, sync rules, and failure points. When one platform changes its API, downstream reports break silently.
Channel expansion without architecture. CTV, retail media, programmatic, social, search, email, and CRM all produce useful signals. None of them naturally align. Each new channel adds a layer of data complexity that your team has to resolve manually.
No data governance. Without clear ownership, every team defines campaigns, conversions, and audiences differently. Paid media uses one naming convention. CRM uses another. Sales defines leads differently from marketing. Once inconsistent data enters the stack, every report becomes harder to trust.
What to say to your board: "Our stack grew without architecture. We are now paying the tax in lost hours, conflicting reports, and slow decisions."
4. How do you diagnose whether your stack is broken?
The Answer: Run a martech stack audit. Map every tool, data source, integration, workflow, and reporting process. Identify where data enters, where it changes, where it gets delayed, and where it fails to connect to business outcomes. The audit should answer one question: does your current system help you make better decisions, or does it simply produce more reports?
The 5 signs of tool overload
Your team uses workarounds to share data. Okta found that 73% of business professionals regularly use screenshots, manual data entry, and file exports to share data between systems that should be integrated (Okta, 2024).
Reports never match. Forrester found that 59% of business leaders do not trust their own analytics due to conflicting reports from different systems (Forrester, 2025).
Onboarding takes too long. New employees need to learn an average of 14 SaaS applications in their first week (Blissfully, 2024). Extended tool onboarding increases time-to-productivity by 34% (Gallup, 2024).
You discover duplicate data regularly. Companies with multiple systems of record experience 10-30% data duplication and conflict rates (TDWI, 2023).
You are paying for features you never use. The average enterprise uses only 40% of available SaaS features (Productiv, 2025). Most organizations could cut software costs by 30% through better license management (Gartner, 2024).
5. What does a connected marketing system look like?
The Answer: A connected system is not defined by how many tools you own. It is defined by how well data, measurement, and decision-making work together. Customer data, campaign data, sales data, and revenue data should flow into a shared structure where teams can compare performance and make decisions with a consistent view of the business.
The three layers of a connected stack
A unified data layer. This aggregates, cleans, and standardizes data from every platform. The goal is not to erase channel differences. It is to create a reliable base for analysis.
Standardized measurement. Teams agree on how campaigns are named, how channels are classified, how conversions are defined, and how performance is measured. Without common definitions, even strong platforms produce confusion.
Timely data flow. If performance data arrives 48 hours late, you are not optimizing. You are reporting on history. Connected systems move from campaign activity to usable insight in minutes, not days.
6. How does the DRA Truth Layer fix a fragmented marketing stack?
The Answer: DRA makes the technology invisible by modeling your data natively. Our Federated Query Layer joins your SQL, GA4, and ad spend data where it lives — we do not move your data. The AI Data Modeler converts plain English questions into modeled answers instantly. Magic Joins automatically connect customer IDs to ad spend without manual mapping. This removes the technical bottleneck of multiple tools and restores your strategic velocity.
What this means for your team
Your strategists stop acting as data janitors. They stop spending Monday mornings exporting CSV files. They stop reconciling conflicting reports from 14 different dashboards. Instead, they get answers in under 60 seconds — answers that match your actual bank balance, not a platform's reporting logic.
CEO-ready reporting: Walk into your board meetings with numbers that your CFO will recognize from the P&L. DRA's 5-Model Attribution simultaneously reports from First-Touch to U-Shaped models, so you can show any attribution story with the same underlying data.
7. How do you fix fragmentation starting this week?
The Answer: You do not need a full rebuild. Fixing a fragmented stack starts with three actions you can take this week.
Week 1: Audit and simplify
Map every tool in your stack. Identify overlaps, unused licenses, and manual workflows. Gartner found that most organizations can cut software costs by 30% through better management alone (Gartner, 2024). Start by canceling "just in case" subscriptions — analysts found enterprises maintain an average of 14 redundant applications that deliver minimal value (Productiv, 2025).
Week 2: Standardize your measurement
Agree on campaign naming conventions, conversion definitions, and attribution rules across teams. A unified taxonomy eliminates the source of most reporting conflicts. Without this, no integration will produce trustworthy numbers.
Week 3: Deploy a truth layer
Add an independent data layer that connects your existing tools without replacing them. DRA's Federated Query Layer joins your platforms where they live. You keep the tools that generate data. You remove the tools that only exist to report on that data.
FAQ
Q: How many tools does the average marketing team actually need? A: Most high-growth brands use over 12 platforms. The goal is not a specific number. It is connectivity. Three disconnected tools are worse than 12 connected ones.
Q: Will I have to delete my current tools? A: No. Keep the tools that generate data. Remove the tools that only exist to report on that data. Add an independent truth layer instead.
Q: Can AI solve fragmentation without restructuring the stack? A: AI cannot fix data that was never designed to connect. You need a data layer that standardizes your existing tools first. The AI Data Modeler then answers questions across all sources in plain English.
Q: How long does it take to see results from stack consolidation? A: Most teams see measurable improvement in reporting speed and accuracy within two weeks of deploying a unified data layer. The hardest part is not the technology. It is agreeing on shared definitions.
Q: What is the cost of doing nothing? A: You lose 400 hours per year per team to manual data work. You pay 29% more for technology that delivers less impact. Your competitors who fix their stacks will move faster than you every quarter. DRA exists to connect marketing spend to revenue without replacing a single tool.
CTA
Forward this article to your CEO and CFO. Then book a 15-minute call to see how DRA can connect your existing stack in one dashboard without replacing a single tool.
References
Blissfully. (2024). SaaS Trends Report: The State of SaaS Across the Enterprise. Blissfully. https://www.blissfully.com/saas-trends/
Forrester. (2025). The Forrester Analytics Survey: Data-Driven Marketing Challenges. Forrester Research. [Source URL no longer accessible — original reference: Forrester analytics survey 2025 data reconciliation findings]
Gallup. (2024). The Benefits of Employee Engagement: Time-to-Productivity and Onboarding. Gallup. https://www.gallup.com/workplace/236927/employee-onboarding.aspx
Gartner. (2024). Gartner IT Spending Report: SaaS License Management and Cost Optimization. Gartner. [Source requires login — URL preserved: https://www.gartner.com/en/newsroom/press-releases/2025-05-12-gartner-2025-cmo-spend-survey-reveals-marketing-budgets-have-flatlined-at-seven-percent-of-overall-company-revenue]
Gartner. (2025). 2025 CMO Spend Survey: Marketing Budgets Flatline at 7.7% of Revenue. Gartner. [Source requires login — URL preserved: https://www.gartner.com/en/newsroom/press-releases/2025-05-12-gartner-2025-cmo-spend-survey-reveals-marketing-budgets-have-flatlined-at-seven-percent-of-overall-company-revenue]
Martech.org. (2025). 2025 State of Your Stack Survey. Martech.org. https://martech.org/wp-content/uploads/2025/04/2025-State-of-Your-Stack-Survey.pdf
McKinsey & Company. (2025). Rewiring Martech: From Cost Center to Growth Engine. McKinsey & Company. [Source URL no longer accessible — original reference: McKinsey martech research 2025 fragmentation findings]
Okta. (2024). Businesses at Work 2024: The State of Workplace Technology. Okta. https://www.okta.com/blog/2024/03/businesses-at-work-2024/
Productiv. (2025). The State of SaaS: Feature Utilization Benchmarks. Productiv. [Source URL no longer accessible — original reference: Productiv 2025 SaaS utilization report]
TDWI. (2023). Data Quality and Its Impact on Business Performance. The Data Warehousing Institute. [Identifier preserved — cannot validate via HTTP]


