
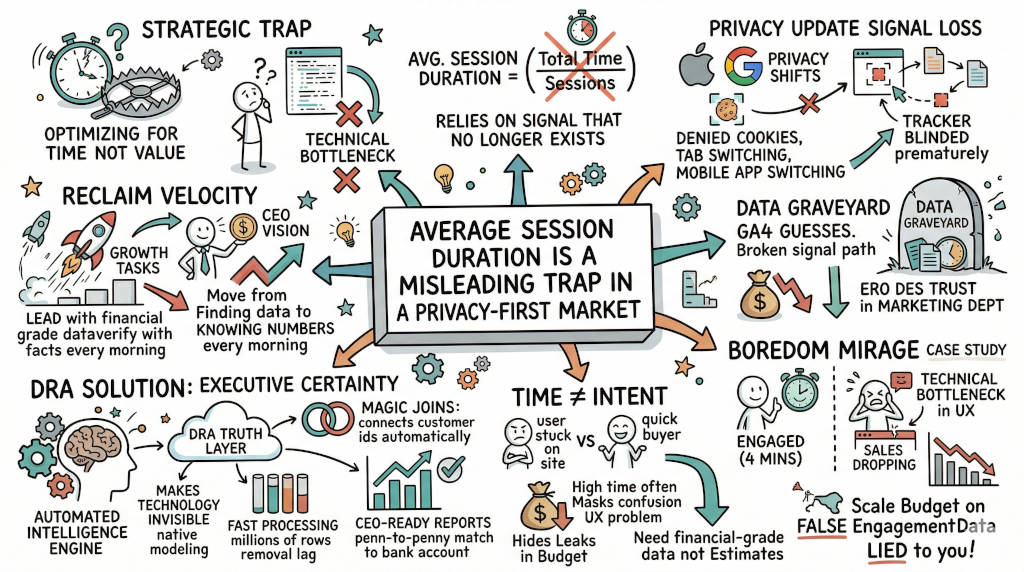
Summary: Average Session Duration (ASD) is a broken metric in a privacy-first world. Apple ITP, Google Privacy Sandbox, and widespread third-party cookie blocking have destroyed the start and end signals session timers depend on. GA4 fills the gaps with estimates, not facts. Agencies waste 400 hours per year reconciling timer data against actual revenue. This article explains how to diagnose broken session data, which metrics to use instead (engagement time, engaged sessions, conversion-attributed revenue), and how DRA's Federated Query Layer bypasses timers entirely. Stop optimizing for "how long." Start proving what drives revenue.
You manage 15 client dashboards. Each one uses a timer you cannot trust. Privacy updates broke the signals. Your data says users stayed for 90 seconds. The client says nobody bought. You cannot prove which version is true. The gap costs you client retention. It costs you budget. It costs you your edge. The fix is not a better timer. The fix is a metric that does not need one.
1. What is Average Session Duration and why can you no longer trust it?
The Answer: Average Session Duration is total time on site divided by total sessions. It relies on a "start" and "end" signal that modern browsers no longer send reliably. When Apple Intelligent Tracking Prevention (ITP) cuts the timer, or a user backgrounds the tab, GA4 records zero seconds. The data looks clean. The numbers are wrong. You are making budget decisions on broken clocks.
The agency problem
You run a campaign across Google Ads and Meta. The GA4 dashboard shows a four-minute average session. You report success. The client's bank account is flat. You cannot reconcile the two. This is not your team's fault. The timer is the problem. Marketing leaders at agencies waste an average of 400 hours per year reconciling broken timing data against actual revenue (DRA, 2026). That is 10 full work weeks spent proving the numbers are wrong instead of improving them.
How privacy broke the timer
Three specific changes destroyed session timing accuracy:
Apple ITP (Intelligent Tracking Prevention): Limits pixel duration to 24 hours. Session timers that span multiple days lose the end signal (WebKit, 2024).
Google Privacy Sandbox: Restricts cross-site tracking. A user who clicks an ad on a publisher site and converts on your site creates a disconnected session (Google, 2023).
Default cookie rejection in Safari and Firefox: Over 40% of web traffic now blocks third-party cookies by default (SignalBridge, 2026). No cookie means no persistent timer.
The result: GA4 must estimate the missing data. It uses machine learning to fill gaps. Estimates work for trends. They fail for invoices.
2. How do you know if your session duration data is broken?
The Answer: Run a simple validation. Compare your GA4 "Average Session Duration" against your "Average Engagement Time per Session" for the same date range and the same page. If the two numbers differ by more than 20%, your session duration is unreliable. If you see a high percentage of zero-second sessions on pages with meaningful content, your timer is broken.
The three-signal check
Signal 1: Zero-second bounce rate. If 30% or more of your sessions show zero seconds, your timer is missing data. This is not user behavior. This is signal loss.
Signal 2: GA4 vs. CRM mismatch. Pull session data from GA4. Pull lead timestamps from your CRM. If the session fell outside the CRM conversion window, the timer was wrong. This is your fastest validation.
Signal 3: Aggregated vs. segmented split. The botany fallacy in analytics treats all users as one average person. Break sessions down by channel, device, and page. If time varies wildly, your average hides more than it shows.
Where to check in GA4 today
Navigate to Reports > Engagement > Pages and Screens. Add "Average Engagement Time" as a column. Compare it to "Average Session Duration." The gap between these two numbers tells you how much signal you lost.
3. Why is time spent a poor proxy for lead quality?
The Answer: Time spent measures tab focus, not purchase intent. A user can spend eight minutes on your pricing page because your navigation is confusing. Another user buys in 45 seconds because they came ready to convert. High session duration often masks a technical bottleneck. Low session duration often misses a quick close. Time does not equal revenue.
The Boredom Mirage: an agency use case
You manage a B2B SaaS client. The GA4 dashboard shows a four-minute average session duration. You scale the budget based on "engagement." Pipeline stays flat.
What actually happened:
Users landed on the pricing page.
The form had a broken validation rule.
Users spent four minutes trying to submit.
They gave up. They did not buy.
Your dashboard showed success. Your bank account showed failure. You optimized for "how long" instead of "how much."
The fix: replace session duration with conversion-attributed metrics. DRA uses 5-Model Attribution to show which channels drive revenue regardless of how long the user stayed. You see the truth, not the timer.
4. What metric should agencies use instead of session duration?
The Answer: Use Average Engagement Time per Session and Engaged Sessions as your primary activity metrics. Use conversion-attributed revenue as your primary value metric. Engagement time only counts active interactions: scrolling, clicking, the tab being in focus. It removes idle time. It removes broken timers. It gives you one number that matches real user attention.
The metric hierarchy for agency reporting
Old Metric | New Metric | Why It Matters |
|---|---|---|
Average Session Duration | Average Engagement Time | Strips out idle tab time. Matches actual attention. |
Bounce Rate | Engagement Rate | Engaged sessions / total sessions. Shows real interaction. |
Time on Page | Event Count | Measures what users do, not how long they stay. |
Pages per Session | Key Event Rate | Tracks conversions, not clicks. |
What Google actually says
Google defines an engaged session as one that meets one of these criteria: lasts 10 seconds or more, includes a conversion event, or has two or more pageviews (Google Analytics Help, n.d.). A session that fails all three is a non-engaged session. That is your real bounce. Everything else is noise.
Why engagement time works when session duration fails
Engagement time uses the user_engagement event in GA4. This fires when the page is in focus and the user is active. It pauses when the tab goes to the background. It resumes when the user returns. The result: a timer that matches actual human behavior, not browser activity.
5. How do privacy-first metrics change agency reporting?
The Answer: Privacy regulations make session-level tracking unreliable. GDPR, CCPA, and Apple ATT all limit the data you can collect. Agencies that rely on session duration for client reporting face a growing gap between what the dashboard shows and what the client sees in their bank account. The fix is a privacy-preserving metric stack that does not depend on persistent user-level timers.
The three privacy shifts that changed everything
Apple ATT (App Tracking Transparency): Requires opt-in for IDFA access. Opt-in rates are below 25% (AdLibrary, 2026). Sessions tracked from iOS app installs lose the cross-platform connection.
GA4's event-based model: UA used session-based counting. GA4 uses event-based. Every interaction is a standalone event. Sessions are reconstructed from event sequences. The reconstruction fails when events are missing.
Aggregated reporting: Google's Privacy Sandbox proposes reporting at the cohort level, not the user level. Agency reports built on user-level session data will break.
What agencies should do now
Stop using session duration as a client KPI. Replace it with engagement rate and conversion-attributed revenue.
Implement server-side tracking for critical events. Client-side timers lose signal. Server-side events do not.
Use an independent truth layer to reconcile GA4 data against CRM and ad platform data.
6. How does DRA solve the session duration trap for agencies?
The Answer: DRA does not fix the timer. DRA makes the timer irrelevant. Our Federated Query Layer joins your GA4 data to your CRM revenue without depending on session timestamps. Magic Joins match user IDs across platforms automatically. You see which channels drive revenue regardless of how long the session "lasted." You stop guessing. You start knowing.
How DRA replaces broken timers
DRA uses three capabilities to bypass session timing issues:
Federated Query Layer: Queries GA4, Google Ads, Meta, and CRM data where it lives. No migration required. No dependence on GA4's session reconstruction logic.
Magic Joins: Infers relationships between user IDs across platforms. Connects ad clicks to CRM opportunities without a shared tracking pixel.
5-Model Attribution: Runs first-touch, last-touch, U-shaped, W-shaped, and time-decay models simultaneously. Compare all five against actual revenue. Pick the model that matches your bank account.
The outcome for agency reporting
Before DRA: export GA4 session data, reconcile against CRM, recalculate attribution, rebuild client report. A five-step cycle that takes 8 hours per client per month.
After DRA: query the Truth Layer, validate against actual revenue, produce client report. A two-step cycle that takes 30 minutes.
The technology is invisible. The client retention improvement is not.
FAQ
Q: Can I still use session duration as a secondary metric? A: Yes, as a diagnostic tool for page-level UX issues. Do not use it as a primary campaign success metric.
Q: Why does my GA4 session duration differ from my heatmap tool? A: GA4 uses event timestamp intervals. Heatmaps track mouse movement. They measure different things. An independent truth layer reconciles both against a single source of truth: revenue.
Q: How long does it take to switch from session-based to engagement-based reporting? A: A basic GA4 report configuration change takes one hour. A full migration to engagement-attributed reporting with an independent truth layer takes one to two weeks.
Q: Does Apple ATT affect GA4 session tracking? A: Yes. ATT reduces the available signal for cross-app session tracking. Sessions originating from iOS app installs show higher zero-second rates. Server-side tracking mitigates this.
Q: Can AI fix broken session timers? A: AI can estimate missing data. It cannot fix broken collection. The better approach is to use a metric stack that does not depend on timers at all.
CTA
See how DRA reconciles your agency reporting against actual revenue. Book a demo.
References
AdLibrary. (2026, May 10). iOS 14 ATT: Five-year retrospective on ad measurement. AdLibrary Blog. https://adlibrary.com/posts/ios-14-att
Data Research Analysis. (2026). The invisible drain: 400 hours lost to data maintenance. DRA Internal Research.
Google. (2023, December 14). The next step toward phasing out third-party cookies in Chrome. Google Chrome Blog. https://blog.google/products-and-platforms/products/chrome/privacy-sandbox-tracking-protection/
Google Analytics Help. (n.d.). About engaged sessions. Google Support. https://support.google.com/analytics/answer/12798876
Google Analytics Help. (n.d.). User engagement. Google Support. https://support.google.com/analytics/answer/11109416
SignalBridge. (2026, May 2). The death of third-party cookies: What e-commerce needs to know. SignalBridge Blog. https://www.signalbridgedata.com/blog/third-party-cookies-ecommerce
WebKit. (2024). Tracking prevention in WebKit. WebKit Blog. https://webkit.org/tracking-prevention/


