
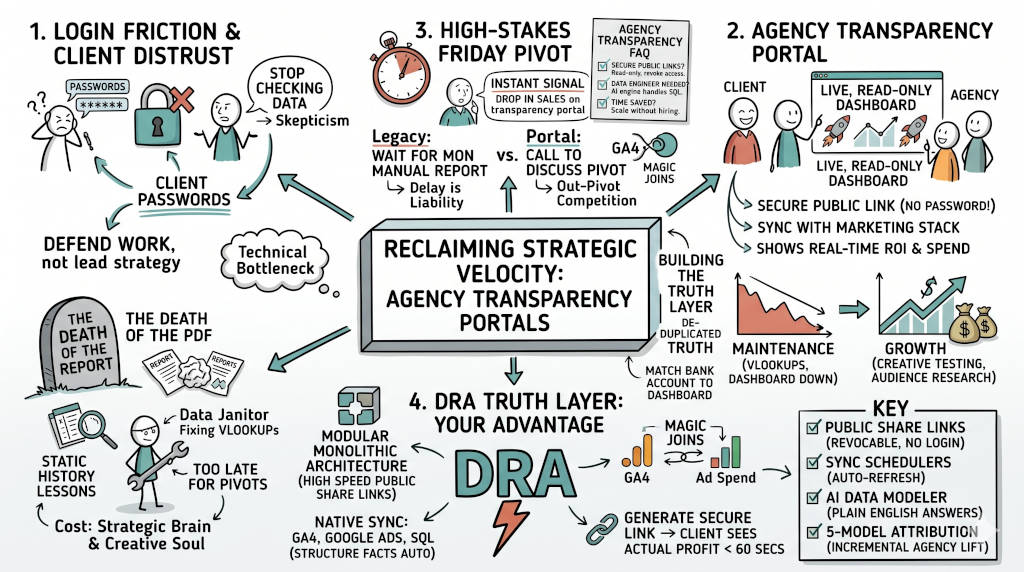
Summary: Client reporting is the primary cause of operational drag in agencies (US Tech Automations, 2026). Login friction stops clients from seeing results — 68% of consumers abandon providers due to slow or complicated access (Thales, 2026). Manual PDFs arrive stale. A live marketing dashboard with a public share link eliminates both. Your team reclaims 10 to 15 hours per client per month (Mullins, 2026; AutoCore AI, 2026). Your clients see current ROI and spend without asking. Trust increases. Strategic velocity returns.
Every month your team builds reports by hand. Every month clients ignore them. Static PDFs arrive too late. Dashboard logins gather dust. The gap between what you deliver and what clients see costs you trust, retention, and billable hours. A live marketing dashboard for clients closes that gap in under 60 seconds. No login. No manual export. No defensive meetings.
1. Why does login friction destroy client trust?
**The Answer: Login friction turns your reporting into a dead end. Clients do not want another password. When access is hard they stop checking. When they stop checking they assume the worst. You end up defending your work in monthly meetings instead of leading the strategy. A live marketing dashboard accessible by public link removes every barrier. It proves your agency has nothing to hide. According to the Thales 2026 Digital Trust Index, 57% of consumers experienced website access issues in the past year, and 68% abandoned or switched providers due to slow performance or complicated sign-up processes (Thales, 2026). A separate PwC survey found that 52% of consumers stopped buying from a brand due to a poor experience (PwC, 2025). Login friction is not an inconvenience. It is a revenue leak.
The PDF is a trust liability
You hired your team for their creative instincts and strategic thinking. You did not hire them to manually export PDFs every Friday. Static reports are history lessons by the time they arrive. When a client must wait for a manual export, trust erodes. Your strategists become data janitors. Their salaries stay the same. Their output shrinks.
2. What is a live marketing dashboard for clients?
The Answer: A live marketing dashboard is a read-only portal accessible through a secure public link. It requires zero credentials. Data refreshes automatically from your marketing stack. Clients see current ROI, spend, and conversions in real time. The technology becomes invisible. The conversation shifts from finding reports to knowing numbers. Strategic velocity returns.
From maintenance mode to growth mode
Traditional reporting is a maintenance spiral. You fix broken VLOOKUPs on Friday. You explain why the dashboard is down on Monday. A live portal eliminates both. Your team stops paying the manual reporting tax. They return to creative testing, audience research, and strategy. Your margins improve because you stop billing clients for data janitor work. Industry research shows agencies spend 4 to 8 senior hours per account per month on manual data pulls and slide-deck assembly (Mullins, 2026). An audit of 12 agencies found 56% of analyst time goes to data plumbing, not strategic analysis (Jaiswal, 2026).
3. What happens when a client spots a problem on Friday morning?
**The Answer: In a traditional setup, the client waits until Monday for a manual report. The delay costs them budget and trust. With a live marketing dashboard they see the signal instantly. They call you to discuss the pivot, not to complain about silence. That speed becomes your competitive edge. It provides the evidence required for executive certainty. Unbounce research found that 53% of go-to-market teams cite technology as the biggest barrier to alignment, and only 30% believe their stack actually enables it (von Hoffman, 2026). DRA eliminates the stack friction so speed becomes structural.
Building the truth layer your clients demand
Clients need their bank account to match your dashboard. You need a system that joins GA4, ad spend, and CRM data natively. Magic Joins connect customer IDs to revenue automatically. This de-duplicated truth ends the argument between platforms. You become an objective referee. Your clients stay. Your agency grows.
4. How does DRA power a live marketing dashboard without the integration headache?
The Answer: Data Research Analysis uses a Federated Query Layer to join GA4, Google Ads, SQL databases, and CSV files where they live. You generate a secure public share link in one click. Your client sees actual profit in under 60 seconds. No data engineering team required. No SQL query writing. The AI Data Modeler handles the infrastructure. You handle the strategy.
What DRA delivers for your agency
We built the platform to end the reporting bottleneck.
Public Share Links: Revocable dashboard access without login friction.
Sync Schedulers: Automated data refreshes. Numbers stay current.
AI Data Modeler: Ask a question in plain English. Get an answer for your client instantly.
5-Model Attribution: Show the actual incremental lift of your creative work.
Multiple Data Sources: Connect Google Ads, GA4, Meta Ads, and more.
5. Can you put your own brand on client dashboards?
**The Answer: Yes. Every dashboard is fully white-label. Apply your logo, your colors, and your custom domain. Clients see your agency in the URL, the header, and every chart. DRA is invisible. Your brand owns the experience. Industry data shows B2B clients are willing to pay up to 20% more for services from an agency offering real-time, transparent reporting versus end-of-month static PDFs (Yuktis, 2026). White-label dashboards create switching costs that keep clients on retainer month after month (1ClickReport, 2026).
Custom domain. Zero DRA branding.
Serve dashboards from your domain. Reports.youragency.com. Clients see a tool you built. Not a third-party reskin. Every plan includes white-label access.
6. How fast can you launch your first client dashboard?
The Answer: Most agencies go from zero to a live client dashboard in under 30 minutes.
Step 1: Connect your data sources — GA4, Google Ads, CRM, and any CSV or SQL database. Step 2: Ask the AI Data Modeler for the metrics your client needs in plain English. Step 3: Generate a public share link. Send it to your client. Step 4: Set a sync schedule. The dashboard updates itself. You never touch it again.
FAQ
Q: Are public share links secure? A: Yes. Revoke access at any time. Links are read-only. Clients cannot see raw data or other accounts.
Q: Do I need a data engineer to set this up? A: No. The AI Data Modeler translates your question into SQL. No engineering required.
Q: How much time will my team save? A: Agencies reclaim 10 to 15 hours per client per month. That is billable time returned to strategy.
Q: Which platforms does DRA connect to? A: Google Ads, GA4, Meta Ads, LinkedIn Ads, Microsoft Ads, Shopify, HubSpot, Mailchimp, Google Search Console, BigQuery, and any SQL database or CSV file. 50+ total integrations.
Q: Can I charge clients for dashboard access? A: Yes. Add live dashboard access as a premium tier in your pricing. Clients pay for transparency. Your agency earns a new revenue stream.
Q: What does it cost? A: Plans start at $29 per month. The Free tier supports 3 projects and 5 data sources. The Starter plan unlocks 15 data sources and 100 AI generations per month.
Stop translating data. Start leading strategy.
Every hour your team spends on manual reporting is an hour your competitor spends on growth. DRA gives you the infrastructure to prove marketing ROI without the overhead. Your clients see live numbers. Your team reclaims billable hours. Your agency moves faster.
References
1ClickReport. (2026, February 15). White-label marketing dashboard guide 2026. https://www.1clickreport.com/blog/white-label-marketing-dashboard-2026
AutoCore AI. (2026, June 6). Automate marketing agency client reporting (2026). https://www.autocoreai.net/blog/automate-marketing-agency-client-reporting
Jaiswal, S. (2026, May 28). We audited 12 marketing agencies' reporting stacks. Here's what costs them the most time. 1ClickReport. https://www.1clickreport.com/blog/agency-reporting-stack-audit-12-agencies-2026
Mullins, G. (2026, May 19). Why are agencies drowning in client reports 2026? US Tech Automations. https://ustechautomations.com/resources/blog/reduce-client-reporting-marketing-agency-with-automation-2026
PricewaterhouseCoopers. (2025, September 29). 2025 customer experience survey. https://www.pwc.com/us/en/services/consulting/commercial-excellence/library/2025-customer-experience-survey.html
Thales. (2026, March 31). Digital trust index 2026: AI skepticism and identity access friction are costing revenue. BusinessWire. https://www.businesswire.com/news/home/20260331668723/en/Digital-Trust-Index-2026-AI-Skepticism-and-Identity-Access-Friction-Are-Costing-Revenue
von Hoffman, C. (2026, April 3). Martech stacks are holding back sales and marketing teams. MarTech. https://martech.org/martech-stacks-are-holding-back-sales-and-marketing-teams/
Yuktis. (2026, March 15). White-labeling AI dashboards: Building unbreakable client trust. https://yuktis.com/blog/white-labeling-ai-dashboards-client-trust