Summary: Manual data translation costs marketing teams 8 hours per week, 400 hours per year, and $24,000 per analyst in maintenance work that produces zero strategic return. No-code data pipelines replace the manual export-clean-reconcile cycle with a governed automated layer. They increase strategic velocity by compressing reporting lag, improve accuracy by removing spreadsheet handoff errors, and reduce burnout by returning analysts to decision-making work. An automated marketing data integration platform like DRA operationalizes this through a Federated Query Layer, Magic Joins, and AI Data Modeler — turning fragmented sources into one governed answer without SQL or CSV files.
The cost of manual data work: 400 hours per year. $24,000 per analyst. Zero strategic return. Every week your marketing team spends 8 hours exporting CSV files, patching broken formulas, and reconciling mismatched numbers. That is not analysis. That is unpaid systems integration. A no-code automated marketing data integration platform removes that layer. The question is not whether you can afford one. The question is whether you can afford another year without one.
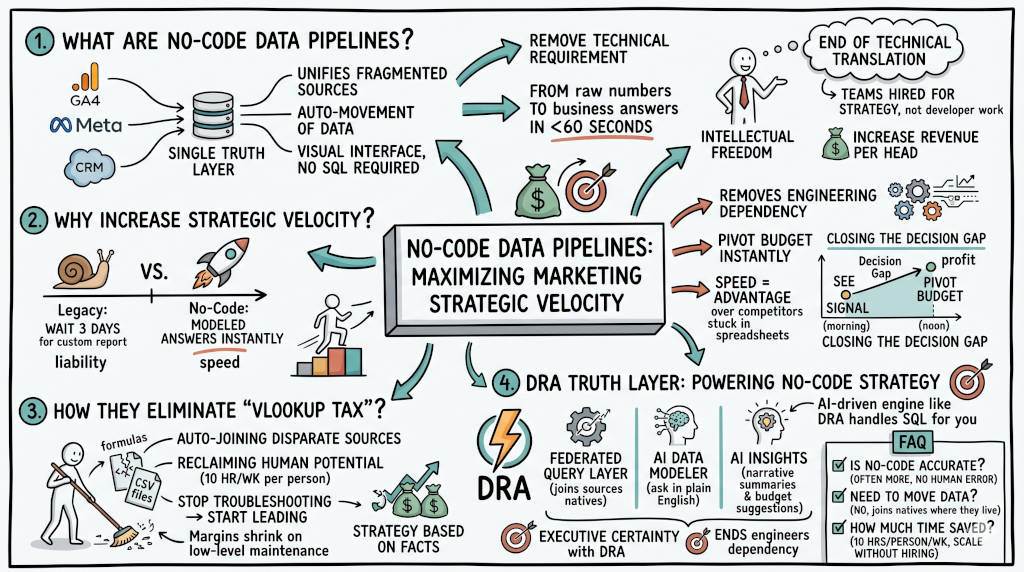
1. What is a no-code data pipeline in marketing?
The Answer: A no-code data pipeline connects marketing sources without SQL, CSV exports, or manual joins. It replaces a fragmented reporting workflow with a governed system. The business result is speed, accuracy, and lower payroll waste.
Why this matters to a leadership team
Marketing data lives in separate systems. Ad spend in Google Ads and Meta. Session data in GA4. Revenue in a CRM or SQL database.
When those systems do not connect, the team becomes the pipeline. They export. They clean. They patch. They rebuild.
That is not strategy. That is unpaid systems integration done by expensive staff.
IBM describes this as a multi-step workflow where requests, clarifications, permissions, and transformations create delays that accumulate across the process (IBM, 2026).
2. What is the real weekly cost of manual data translation?
The Answer: 8 manual hours per week per analyst. Across 50 working weeks, that equals 400 hours per year. At a fully loaded cost of $60 per hour, that is $24,000 per person per year spent on maintenance instead of growth.
The corrected math
The baseline is conservative. McKinsey found that interaction workers spend nearly 20 percent of the workweek looking for information or tracking down colleagues. On a 40-hour week, that equals 7.6 hours. Over 50 weeks, that is 380 hours before adding cleanup and correction work (McKinsey Global Institute, n.d.). [Source URL no longer accessible — original reference: McKinsey Global Institute. The social economy: Unlocking value and productivity through social technologies.]
Eight hours is a defensible floor for an analyst managing multiple platforms (McKinsey Global Institute, n.d.).
Annual cost by team size
That payroll does not buy more experiments. It buys maintenance.
3. Why do no-code pipelines increase strategic velocity?
The Answer: They remove the delay between a business question and a usable answer. Manual reporting chains add queue time, clarification time, and cleanup time. GA4 adds its own processing delay. When a system reduces those handoffs, the team moves from waiting to acting.
Where the delay comes from
Google confirms that GA4 data processing can take 24 to 48 hours and that data in reports may change during that time (Google Analytics Help, n.d.).
Once manual reconciliation starts, the delay gets longer. IBM notes that data access workflows can take days or weeks because each request passes through multiple dependencies (IBM, 2026).
The real reporting lag is not one slow platform. It is platform delay plus human delay.
Why speed changes outcomes
A slow report turns a live market into a history lesson. A bad campaign burns budget for two extra days. A good trend peaks before the report is ready.
No-code pipelines compress this delay. They do not just save analyst time. They protect budget timing.
4. Do no-code pipelines improve reporting accuracy?
The Answer: Yes, when they remove repetitive manual handling. Manual chains fail at the handoff points: export, copy, paste, merge, formula edit, reconciliation. A no-code pipeline reduces those handoffs. It does not remove the need for governance. It removes the avoidable errors from spreadsheet maintenance.
The spreadsheet risk is real
EuSpRIG maintains a long-running archive of spreadsheet failures across finance, healthcare, government, and operations. Incidents include regulatory fines, exposed personal data, and calculation errors producing losses from thousands to millions of dollars (European Spreadsheet Risks Interest Group, n.d.).
One manual step is rarely the full problem. The real problem is uncontrolled repetition. The same file gets copied, edited, emailed, and trusted. That is how silent error reaches the boardroom.
Accuracy is also a trust problem
When a report changes after a leadership meeting, the damage is larger than the formula. Trust drops. Strategy is judged through a credibility gap. The system that prepares the number is part of the number.
5. What does a no-code pipeline change for staffing and burnout?
The Answer: It changes role quality. Marketers stop being technical translators. They return to channel strategy, creative testing, and budget decisions. That lowers hidden payroll waste and reduces the attrition risk from repetitive maintenance work.
The replacement cost leaders ignore
Gallup reports that the cost of replacing an employee can range from one-half to two times that employee's annual salary (McFeely & Wigert, 2019).
Data drudgery creates a double cost. First, the hours lost each week. Second, the cost when strong staff leave because the role became maintenance-heavy. For a mid-level analyst on a $72,000 salary, replacement cost ranges from $36,000 to $144,000. That cost sits outside the spreadsheet used to defend the current process.
The operating model shift
Without automation, an analyst does three jobs: reporter, cleaner, translator.
With a no-code pipeline, that person returns to one job: decision maker.
6. How does an automated marketing data integration platform turn pipelines into governed answers?
The Answer: An automated marketing data integration platform like DRA operationalizes the no-code model at the architecture layer. The Federated Query Layer joins sources where they live. Magic Joins infers relationships across IDs and revenue records. The AI Data Modeler converts plain English questions into executable SQL. The result is one governed answer without the manual export cycle.
What DRA removes from the weekly workflow
The manual cycle is predictable: export, clean, reconcile, present. DRA removes each stage.
Federated Query Layer: Query GA4, ad platforms, and SQL sources directly.
Magic Joins: Infer relationships between click IDs, user IDs, and CRM records.
AI Data Modeler: Convert plain English questions into exact SQL.
Sync Schedulers: Keep refreshes consistent without manual trigger cycles.
CEO Ready Reports: Deliver live views for leadership decisions.
This is the practical value of no code. Teams stop building reports about the past. They start deciding from current signals.
7. How do you choose the right automated marketing data integration platform?
The Answer: Look for three capabilities. First, a federated query layer that joins sources without moving data. Second, AI-powered modeling that turns questions into queries. Third, governed output that leadership can trust without a data team in the room.
DRA meets all three. The platform connects Google Ads, GA4, SQL databases, and more through a single Federated Query Layer. The AI Data Modeler converts English questions into exact SQL. CEO Ready Reports present live, governed answers for leadership decisions.
What to avoid
Avoid platforms that require a data engineer to set up or maintain. Avoid platforms that export to spreadsheets for final delivery. Avoid platforms that cannot connect marketing spend to revenue.
The right platform removes the translation layer entirely. Your team asks a question. The platform answers. No export. No spreadsheet. No waiting.
FAQ
Q: Is a no-code pipeline only for small teams without engineers? A: No. It matters most when marketing depends on multiple systems and needs governed answers fast. Larger teams feel the drag more because the handoffs multiply.
Q: What is the time loss baseline for manual data work? A: 8 hours per week per analyst. That equals 400 hours per year across 50 working weeks.
Q: Do no-code pipelines eliminate governance risk by themselves? A: No. They reduce manual failure points. Governance still requires controlled modeling, review, and a consistent truth layer.
Q: Can no-code pipelines reduce report lag if GA4 still changes during processing? A: They reduce the manual portion of the delay. They do not change Google's platform-level processing rules.
Q: What does this mean in payroll terms for one analyst? A: At $60 per loaded hour, 400 hours of manual work equals $24,000 per year redirected away from strategic output.
Q: What role does an automated marketing data integration platform play? A: It joins fragmented marketing sources into a single governed layer. The team stops maintaining the pipeline and starts using the answers.
References
Data Research Analysis. (2026). The invisible drain: Is your marketing team losing 400 hours a year to data drudgery? https://www.dataresearchanalysis.com/articles/the-invisible-drain-is-your-marketing-team-losing-400-hours-a-year-to-data-drudgery
European Spreadsheet Risks Interest Group. (n.d.). Horror stories. https://eusprig.org/research-info/horror-stories/
Google Analytics Help. (n.d.). Data freshness and Service Level Agreement constraints. https://support.google.com/analytics/answer/12233314
IBM. (2026). Data delivery delays are slowing decisions more than you think. https://www.ibm.com/think/insights/data-access-delays-slowing-decisions
McFeely, S., & Wigert, B. (2019, March 13). This fixable problem costs U.S. businesses $1 trillion. Gallup. https://www.gallup.com/workplace/247391/fixable-problem-costs-businesses-trillion.aspx
McKinsey Global Institute. (n.d.). The social economy: Unlocking value and productivity through social technologies. [Source URL no longer accessible — original reference preserved.]