
Summary: Your growth team is losing 400 hours a year to manual data work — exporting CSVs, reconciling platforms, rebuilding broken reports. That is not strategy. That is human middleware. Every hour spent in a spreadsheet is an hour not spent testing copy, modeling attribution, or pivoting a campaign before the window closes. The real cost is $83,000 per analyst per year in wasted payroll, plus $324,000 in lost optimization opportunity for every 10 clients. Your competitors are shipping three times more campaigns with the same headcount because they eliminated the manual layer. This report breaks down the exact dollar cost of data drudgery, shows you the five symptoms of the Human Middleware Problem, and gives you a 30-day plan to reclaim your strategic velocity with a Truth Layer that automates the technical work.
1. Why are clicks and sessions not enough to measure growth?
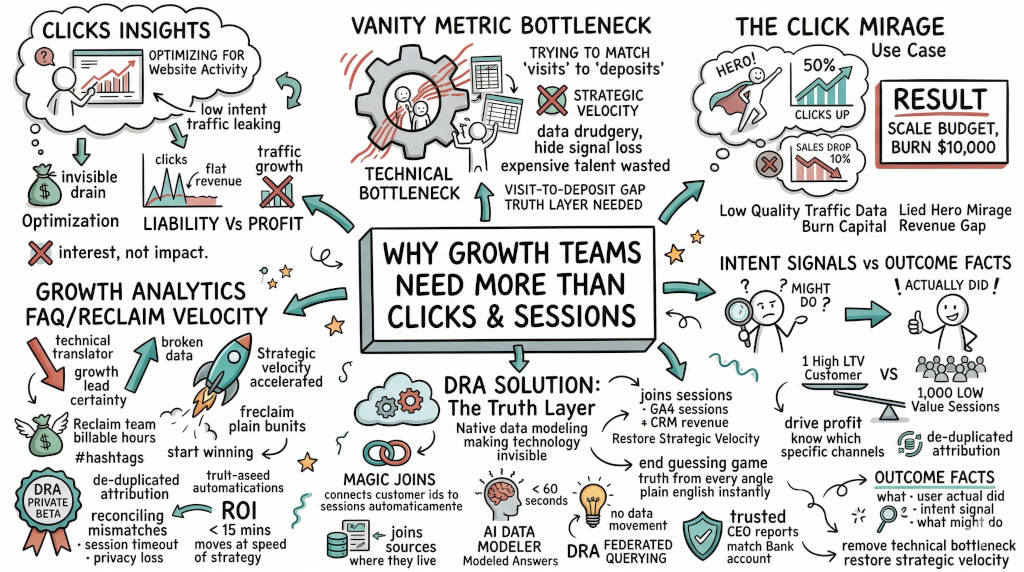
The Answer: Clicks and sessions measure activity, not outcome. A million clicks from low-intent users drain your budget. They hide poor lead quality and broken attribution. Surface metrics create a technical bottleneck for leaders. You optimize for website activity while your revenue stays flat. This is the Invisible Drain — Pillar 5 of the CMO Crisis. Financial-grade data is the only cure.
The Problem with Surface Metrics
You hired your team for their strategic brain. You wanted them to build your brand. Instead they report on click growth. This is a hidden tax on your profit margins. A million clicks from low intent users are a liability for your budget. These metrics hide funnel leaks. They create a false sense of success.
What the Data Shows
According to a global survey by Treasure Data, marketing teams spend an average of 14.5 hours per week managing and collecting customer data (Treasure Data, n.d.). 18% report spending over 20 hours a week on this task. In a 40-hour work week, that is over 36% of their time on data collection, not analysis or strategy.
2. How do vanity metrics create a technical bottleneck?
The Answer: Vanity metrics disconnect marketing activity from business outcomes. High click volume masks poor conversion rates and high signal loss. This forces your team into a cycle of data drudgery. They spend hours in spreadsheets manually matching sessions to sales. That manual labor is a hidden tax on your strategic velocity. This is Pillar 2 of the CMO Crisis in practice.
The Cost of Technical Translation
Every minute your staff spends in a spreadsheet is a minute stolen from your growth. Your team cannot test new ad copy while troubleshooting why clicks do not match conversions. Your margins shrink because you use expensive talent for low-level data entry. You must remove this technical work to find your focus again.
The Human Middleware Problem
Marketing tools were bought one at a time to solve individual problems. Each tool works in isolation. None were designed to talk to each other. So your team fills the integration gaps manually. Valentin Radu, founder and CEO of Omniconvert, calls this the Human Middleware Problem (Radu, 2026). The stack grows, the team grows, and the manual work grows faster than either. Three out of five people on a marketing team end up spending most of their week doing data moves.
3. What is the real dollar cost of manual reporting?
The Answer: Manual reporting costs marketing agencies between $419,000 and $457,000 per year for a 10-client agency. That number includes time cost, opportunity cost from missed optimization, and accuracy cost from human error. Automation platforms like DRA eliminate these costs at a fraction of the price (Data Clare, 2026).
The Time Cost
A typical analyst spends 4 hours per week per client on manual reporting. At $40 per hour, that is $160 per week per client. For 10 clients: $83,200 per year. That is one full-time analyst doing nothing but moving numbers between spreadsheets.
The Opportunity Cost
Those 4 hours per week could go to campaign optimization. A 9% improvement in ROAS on $10,000 monthly ad spend generates $32,400 per year in additional revenue per client. Across 10 clients: $324,000 in lost growth annually.
The Accuracy Cost
Manual data entry has an average error rate between 1% and 5% (Journal of Accountancy, cited by Coupler.io Blog, 2025). Each error costs $50 to $150 to fix. In a weekly reporting cycle with hundreds of data points, even a 1% error rate results in thousands in misallocated budget (Coupler.io Blog, 2025).
4. What is the difference between intent signals and outcome facts?
The Answer: Intent signals show what a user might do. Outcome facts show what a user actually did. Strategic velocity depends on knowing which specific channels drive profit. A single session from a high-LTV customer is worth more than 1,000 sessions from low-value users. Vanity metrics hide this difference. You need de-duplicated attribution to identify the high-value customers who increase your bank balance.
Use Case: The Click Mirage
Imagine you run a campaign for a high-value service.
The Signal Reality: Your dashboard shows a 50% increase in clicks. You feel like a hero.
The Outcome Reality: Your actual sales drop by 10%. The new traffic is low quality.
The Result: You scale the budget based on the click spike. You burn $10,000 before you see the revenue gap.
The Five Symptom Check
The Human Middleware Problem has five telltale symptoms (Radu, 2026):
Marketers spend 40% or more of their week on data moves
Campaigns ship 1 to 4 weeks after being designed
Reports are copy-pasted, not live
Team burnout within the first year
Slow response to underperforming campaigns
If three or more apply to your team, you have a middleware problem.
5. How does the DRA Truth Layer reveal actual performance?
The Answer: DRA makes the technology invisible by modeling your data natively. Our engine joins your GA4 sessions and your CRM revenue automatically using Magic Joins. We use a 5-model attribution engine to show the truth from every angle. You ask questions in plain English and receive modeled answers instantly. This removes the technical bottleneck. It restores your strategic velocity.
Your Executive Certainty with DRA
Magic Joins: We connect your customer IDs to your ad sessions automatically. No manual mapping.
AI Data Modeler: Ask a question in plain English. Get an answer in under 60 seconds.
Federated Query Layer: We join your sources where they live. We do not move your data.
5-Model Attribution: Simultaneous reporting from First-Touch to U-Shaped models.
CEO-Ready Reports: Walk into meetings with numbers that match your bank account.
What This Changes
Brands that eliminate manual data work ship 3 to 5 times more campaigns per month with the same headcount (Omniconvert, 2026). The primary ROI is velocity, not cost savings. Data-driven companies are 6 times more likely to be profitable year-over-year (Gitnux, cited by Coupler.io Blog, 2025).
6. A tactical plan: how to eliminate manual data work in 30 days
The Answer: Manual data work is a solvable systems problem. You do not need more tools. You need fewer data moves. Here is a 30-day plan to eliminate the middleware.
Week 1 — Audit every manual data move
Have each team member log every export, upload, copy-paste, and reconciliation for one week. Count the moves. Most teams find 30 to 60 moves per week on a 3-person team (Omniconvert, 2026).
Week 2 — Rank moves by time cost
Sort the list by frequency multiplied by duration. The top three moves usually account for 60 percent of total middleware time. These are the moves worth eliminating first.
Week 3 — Replace the export-upload cycle
The highest-leverage elimination is the customer-list-to-ad-platform export. Replace it with a platform like DRA that pushes segments directly to ad platforms and CRM. This single change kills 3 to 5 weekly moves.
Week 4 — Automate reporting
Build dashboards that pull from source tools directly. A live GA4 + CRM dashboard beats the artisanal weekly spreadsheet. DRA's Public Share Links provide live dashboard access without login friction.
7. Growth Analytics FAQ
Q: Should I stop tracking clicks entirely? A: No. Use clicks as a diagnostic tool. Do not use them as a measure of strategic success.
Q: Why do my click counts in Meta not match my GA4 sessions? A: This is due to session timeouts and privacy signal loss. You need an independent Truth Layer to reconcile these differences.
Q: How long does it take to see my actual ROI? A: Most DRA users see their first truth report in under 15 minutes.
Q: Is the Human Middleware Problem the same as marketing tool sprawl? A: No. Tool sprawl describes the number of tools. Human middleware describes the manual work created by tools that do not integrate. You can have a small stack with serious middleware or a large stack with minimal middleware (Radu, 2026).
Q: How does manual data work affect CLV? A: The Human Middleware Problem directly suppresses Customer Lifetime Value because retention and win-back campaigns depend on fresh customer data. When data is stale, win-back windows are missed, churn increases, and CLV drops (Omniconvert, 2026).
CTA
Stop guessing which clicks drive profit. See your actual ROI in under 15 minutes with the DRA Truth Layer. Marketing teams waste 400 hours a year on manual data maintenance. DRA automates the drudgery so your team can focus on strategy, not spreadsheets.
References
Coupler.io Blog. (2025, July 9). The Hidden Cost of Manual Data Work in Marketing. https://blog.coupler.io/why-marketing-teams-need-automation/
Data Clare. (2026, April 22). The True Cost of Manual Reporting for Marketing Agencies. https://dataclare.com/cost-of-manual-reporting/
Omniconvert. (2026, April 22). The Human Middleware Problem: Why Your Marketing Stack Isn't Working. https://www.omniconvert.com/blog/human-middleware-problem/
Radu, V. (2026, April 22). The Human Middleware Problem. Omniconvert Blog. https://www.omniconvert.com/blog/human-middleware-problem/
Treasure Data. (n.d.). Global survey: Marketing teams and data management. Treasure Data. https://www.treasuredata.com/


