
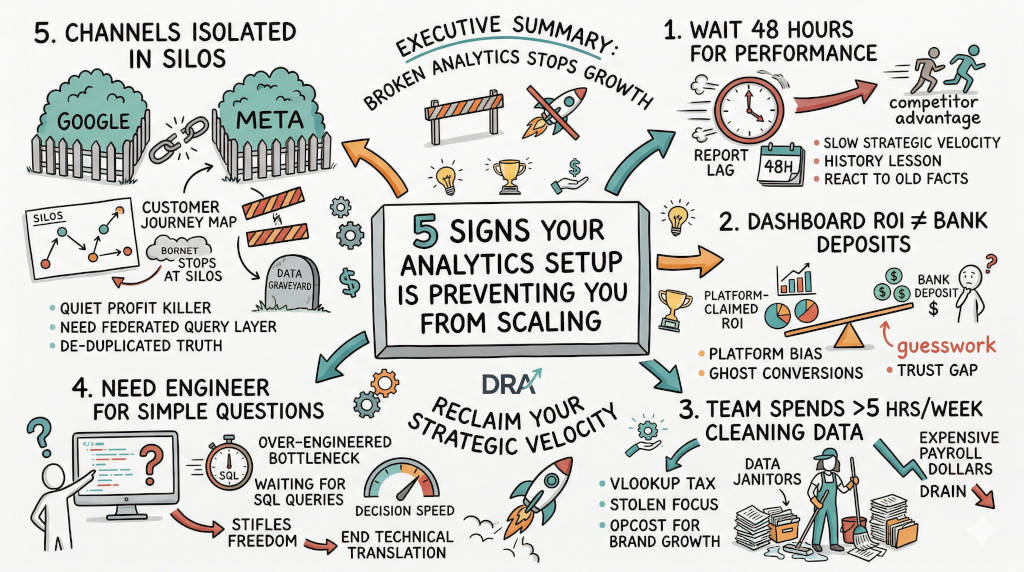
Summary: Most analytics setups cannot scale — and that failure directly blocks a CMO's ability to prove ROI to the board. This article identifies seven diagnostic questions every marketing executive should ask. A 48-hour report lag means you make decisions on yesterday's data. Dashboards that fail to match your bank account indicate platform bias inflating attribution. Teams that spend 5 or more hours weekly cleaning spreadsheets are paying the Invisible Drain. The article provides a five-step action plan for diagnosing whether your tool stack is fit for growth. Gartner reports that only 52% of marketing leaders can prove their value (Gartner, 2024). The gap between reported and real ROI is the gap between surviving budget season and leading it.
Your analytics setup is costing you the ability to prove ROI. Every 48-hour report lag, every dashboard that does not match your bank deposits, every hour your team spends cleaning data instead of building strategy — these are not operational hiccups. They are structural barriers that prevent you from connecting spend to revenue. If you cannot prove ROI, you cannot defend your budget. And if you cannot defend your budget, you cannot scale.
1. What is analytics scaling and why does it matter for proving ROI?
The Answer: Analytics scaling is the ability to maintain fast, accurate, and unified reporting as your data volume, channel count, and team size grow. When your setup does not scale, your ROI proof breaks first.
For a CMO or VP of Marketing, scaling is not a technical concern. It is a strategic one. Your board wants to know two things: did the marketing spend produce revenue, and can you prove it? A setup that cannot scale answers neither question.
McKinsey research found that companies successfully scaling analytics outperform peers by a wide margin in nine critical areas, including data strategy, governance, and embedding analytics into decision-making (McKinsey & Company, 2019). The companies that fail share one trait: they invest in tools that create more data but less truth.
Gartner reports that only 52% of senior marketing leaders can prove marketing's value and receive credit for its contribution to business outcomes (Gartner, 2024). Nearly half of all CMOs walk into board meetings without the numbers to defend their spend.
The Scaling-ROI Connection
When your analytics scales, you get answers in seconds not days. Your dashboards match your bank account. Your team spends time on strategy, not spreadsheets. Your ROI proof becomes audit-ready. When it does not scale, you get the opposite: 48-hour lags, phantom conversions, and a CMO who cannot sleep before board meetings.
Relevance for CMOs: If your team spends more time explaining the data than acting on it, your setup is the problem — not your team.
2. Do you wait 48 hours to see your actual campaign performance?
The Answer: Yes, and that 48-hour lag is the single fastest way to lose strategic velocity (Gartner, 2025). When your data is two days old, you are not making decisions. You are reading history.
Your competitors are not waiting. They are pivoting budgets, scaling winners, and cutting losers while you wait for GA4 to finish processing. A 48-hour report lag means you make today's decisions on yesterday's reality.
The Real Cost of Lag
Assume you spend $50,000 per day on paid media. A 48-hour window where you cannot see actual performance means $100,000 in spend before you can correct a poorly performing campaign. Over a quarter, that is millions in potential waste. Gartner's 2025 CMO Spend Survey found that marketing budgets have flatlined at 7.7% of overall company revenue, making every dollar of waste harder to absorb (Gartner, 2025).
DRA eliminates this lag. Our Federated Query Layer joins GA4, SQL, and Ads data where it lives and returns answers in under 60 seconds. No processing windows. No overnight batch jobs. Real-time facts that let you pivot before your competitor does.
Action step: Check your GA4 property. Note the time stamp of your most recent data. If it is more than 60 minutes old, you have a strategic velocity problem.
3. Does your dashboard ROI fail to match your actual bank deposits?
The Answer: Yes, and this is the clearest sign that your analytics setup is preventing you from scaling. When your dashboard shows success but your bank account shows flat revenue, you have an ROI proof gap, not a performance problem.
Ad platforms act as their own referees. Google Ads claims credit for organic sales. Meta double-counts conversions across devices. GA4 uses modeled data that inflates attribution by 15 to 40 percent depending on your traffic mix. These are not bugs. They are design features that encourage more spend.
HubSpot's 2026 marketing statistics report found that 31% of marketers still cannot track ROI as a top metric despite having analytics platforms deployed (HubSpot, 2026).
The Trust Gap
You cannot prove your value to the board with numbers you do not trust. Every time a CFO asks why revenue does not match the marketing dashboard, your credibility erodes. This is the Executive Trust Gap in practice (Bettati et al., 2025).
DRA solves this with 5-Model Attribution that runs simultaneously. You see First-Touch, Last-Touch, Linear, Time-Decay, and U-Shaped models side by side against your actual CRM revenue data. No platform bias. No ghost conversions. Financial-grade facts that match your bank account.
Action step: Pull your GA4 revenue for last month. Pull your actual bank deposits for the same period. If the difference exceeds 15 percent, your attribution is unreliable.
4. Does your team spend more than 5 hours a week cleaning data instead of building strategy?
The Answer: Yes, and those hours are the Invisible Drain on your marketing margin. You are paying six-figure salaries for spreadsheet work.
The DRA skill identifies this as Pillar 5: The Invisible Drain. McKinsey research confirms that knowledge workers spend 19% of their workweek searching for and gathering information (McKinsey & Company, 2019). For a 40-hour week, that is 7.6 hours per person. For a team of five marketing leaders, that is 2,000 hours — roughly one full-time employee's year — spent on VLOOKUPs and pivot tables instead of strategy.
HubSpot data shows that marketing teams spend an average of 14.5 hours per week managing and collecting customer data manually (HubSpot, 2026).
The Opportunity Cost
Every hour a marketing director spends cleaning data is an hour they are not testing creative, optimizing campaigns, or building the strategy that actually drives revenue. Your team was hired for their strategic brain and creative soul. Your analytics setup is forcing them to act as data janitors.
DRA's AI Data Modeler converts plain English questions into complex SQL automatically. Your team asks "What was our ROAS by channel last week?" and gets a modeled answer in seconds. No SQL required. No data engineer needed. The technical translation trap disappears.
Action step: Track how many hours your team spent in spreadsheets last week. Multiply by 52. That is the annual VLOOKUP Tax on your focus.
5. Do you need a data engineer to answer a simple business question?
The Answer: Yes, and that is Pillar 6: The Technical Translation Trap. Technology should be invisible to the leader. If you need a specialist to ask "What was our profit last month?" your setup is over-engineered for the wrong problem.
CMOs should not need a degree in data science to talk to their numbers. Yet this is the reality at most mid-market companies. The marketing team waits for the analytics team, who waits for the data engineering team, who finally returns a query that answers last month's question.
Only 30% of CMOs report mature AI readiness capabilities in their organizations (Gartner, 2026). The barrier is not willingness to invest. It is data foundations that cannot support the investment.
Ending the Translation Cycle
DRA's AI Data Modeler, powered by Gemini 2.0, eliminates this chain. You ask in English. It generates the SQL. You get the answer. No tickets. No delays. No translation loss.
This is not a convenience feature. It is a strategic multiplier. When you can ask any question and get a modeled answer in under 60 seconds, your decision speed matches your strategic ambition.
Action step: Count how many times last month you needed to submit a data ticket or ask an engineer for a basic report. Each one represents a decision you made without the facts you needed.
6. Are your marketing channels isolated in disconnected silos?
The Answer: Yes, and silos are the quiet profit killer that most CMOs do not see until the quarterly review reveals a channel that looked profitable but was actually losing money.
Google knows about Google. Meta knows about Meta. Neither tool knows your actual customer journey. This fragmentation creates a data graveyard where valuable signals remain buried. You might scale a campaign that looks good in one silo but is actually eroding margin across the full funnel.
McKinsey found that companies with integrated data strategies outperform fragmented organizations across nearly every dimension of marketing performance (Bettati et al., 2025).
Breaking the Silos
DRA's Magic Joins automatically infer relationships between user IDs and emails across platforms. Our Federated Query Layer joins your sources where they live — no data movement required. You get a single truth layer that reconciles spend to revenue across every channel.
This is the foundation of provable ROI. Without it, you are making million-dollar decisions on fragmented data.
Action step: Map your current reporting architecture. List every platform that touches your customer data. If they do not feed into a single truth layer, you have a silo problem that prevents scaling.
7. What is the first step to fix an analytics setup that blocks scaling?
The Answer: Audit your data latency, your attribution accuracy, and your team's time allocation. These three metrics tell you everything about whether your setup can scale.
Step 1: Measure your data latency. How old is your freshest campaign data right now? If it exceeds one hour, your strategic velocity is compromised.
Step 2: Reconcile your dashboard against your bank. Pull last month's reported revenue from your analytics platform. Pull actual revenue from your CRM or bank. The gap is your ROI proof gap. Gartner reports that only 23% of CMOs have full confidence in their marketing attribution numbers (Gartner, 2024).
Step 3: Audit your team's time. Track how many hours your marketing leaders spend in spreadsheets vs. building strategy. If the ratio is worse than 20:80, the Invisible Drain is active.
Step 4: Map your data architecture. Count how many platforms touch your customer data. If they do not feed a unified truth layer, you are managing silos, not marketing.
Step 5: Evaluate your tool stack. If you need a data engineer to answer a basic question, your setup is over-engineered. If your dashboard takes 48 hours to update, it is too slow. Both prevent scaling.
FAQ
Q: How do I know if I need to optimize my current setup or replace it entirely? A: If your data latency is under one hour and your dashboard matches your bank within 10 percent, optimize. If both are off, replace. You cannot fix a broken foundation with better dashboards.
Q: What is the fastest way to improve ROI proof without buying new software? A: Reconcile your GA4 revenue against your CRM. Identify the gap. Use UTM governance and clean up your conversion events. These steps recover 10 to 20 percent of attribution accuracy immediately (HubSpot, 2026).
Q: How much should a mid-market company spend on analytics infrastructure? A: Gartner reports that only 30% of marketing organizations have mature AI readiness (Gartner, 2026). If your analytics tools cost more than 5 percent of marketing spend and you still cannot prove ROI, you are overpaying for underperformance.
Q: Can DRA work with my existing GA4 and Google Ads setup? A: Yes. DRA's Federated Query Layer joins your existing data sources where they live. You keep your current tools. You get a unified truth layer on top.
Q: How long does it take to implement a unified analytics layer? A: Most mid-market teams are live with DRA in under two weeks. The Federated Query Layer connects to your existing stack. No data migration required.
CTA
Prove ROI and scale with confidence. Run the five-step audit above. If your data latency exceeds one hour or your dashboard does not match your bank, you know the setup is blocking your growth. DRA gives you the truth layer to prove ROI and scale with confidence.
References
Bettati, A., Jacobs, J., Robinson, K., & Tas, R. (2025, June 16). Tapping into the full power of CMOs. McKinsey & Company. https://www.mckinsey.com/capabilities/growth-marketing-and-sales/our-insights/the-cmos-comeback-aligning-the-c-suite-to-drive-customer-centric-growth
Data Research Analysis. (2026). Strategic velocity: Real-time marketing analytics at the speed of now. https://www.dataresearchanalysis.com/strategic-velocity
Gartner. (2024, September 18). Gartner survey finds only 52% of senior marketing leaders can prove marketing's value and receive credit for its contribution to business outcomes [Press release]. https://www.gartner.com/en/newsroom/press-releases/2024-09-18-gartner-survey-finds-only-52-percent-of-senior-marketing-leaders-can-prove-marketings-value
Gartner. (2025, May 12). Gartner 2025 CMO spend survey reveals marketing budgets have flatlined at 7.7% of overall company revenue [Press release]. https://www.gartner.com/en/newsroom/press-releases/2025-05-12-gartner-2025-cmo-spend-survey-reveals-marketing-budgets-have-flatlined-at-seven-percent-of-overall-company-revenue
Gartner. (2026, May 11). Gartner 2026 CMO spend survey finds CMOs allocate 15.3% of marketing budgets to AI, but only 30% are ready to scale AI capabilities [Press release]. https://www.gartner.com/en/newsroom/press-releases/2026-05-11-gartner-2026-cmo-spend-survey-finds-cmos-allocate-15-point-3-percent-of-marketing-budgets-to-ai-but-only-30-percent-are-ready-to-scale-ai-capabilities
HubSpot. (2026). 2026 marketing statistics, trends, and data. https://www.hubspot.com/marketing-statistics
McKinsey & Company. (2019). Breaking away: The secrets to scaling analytics. McKinsey Analytics. https://www.mckinsey.com/~/media/McKinsey/Business%20Functions/McKinsey%20Analytics/Our%20Insights/Breaking%20away%20The%20secrets%20to%20scaling%20analytics/Breaking-away-The-secrets-to-scaling-analytics.pdf


