
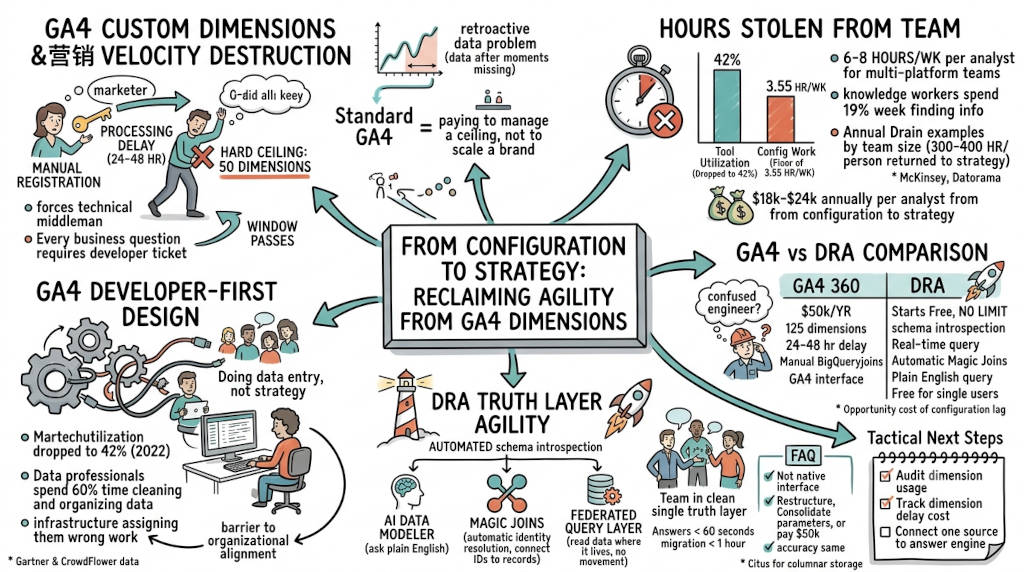
Summary: GA4 custom dimensions require manual registration for every data point your team wants to track — product categories, campaign types, content authors. Each new dimension carries a 24-to-48-hour processing delay before data populates. GA4 enforces a hard limit of 50 per standard property. Hit that ceiling and you either delete existing dimensions or upgrade to GA4 360 at $50,000 per year. Research shows teams lose 6 to 8 hours per week per analyst to configuration work. This article breaks down the structural cost of that friction, compares DRA against GA4 360, and gives you a three-step action plan to reclaim your team's strategic hours.
1. What Are Custom Dimensions and Why Do They Destroy Your Marketing Velocity?
The Answer: Custom dimensions are manual configuration labels required to track specific data points in GA4. Every unique attribute you want to report on — a product category, a content author, a campaign type — requires a separate dimension registered in advance. You cannot retroactively collect data for a dimension you have not yet created. This architecture forces your team to act as technical translators before they can act as strategists. Every new business question requires a developer ticket before it generates an answer.
The Setup Trap
You hired your team for creative vision and fast decisions. You needed them to pivot campaigns before the window closes.
Instead, they spend their week in the GA4 Admin panel. They register event parameters as custom dimensions one by one. They wait for data to populate. Then they rebuild the report from scratch.
This is not strategy. This is configuration management.
GA4 enforces a hard ceiling of 50 custom dimensions per standard property: 25 event-scoped and 25 user-scoped (Google, n.d.). Once you hit that limit, every new tracking requirement forces you to delete an existing dimension or upgrade to GA4 360 at enterprise pricing. You are paying to manage a ceiling, not to scale a brand.
The Retroactive Data Problem
GA4 does not backfill data for new custom dimensions. The moment you register a dimension, data collection begins going forward. Everything before that moment is permanently missing.
This creates a recurring pattern: your team identifies a reporting gap. They register a new dimension. They wait 24 to 48 hours for it to populate (Google, n.d.-b). By the time the data exists, the campaign window has often passed.
You are tracking the last decision. You cannot track the next one fast enough.
2. How Many Hours Does GA4 Configuration Actually Steal From Your Team?
The Answer: Research supports a range of 6 to 8 hours per week per analyst for teams managing five or more data platforms. The Datorama study found a floor of 3.55 hours per week for teams managing two or three platforms (Datorama, 2019). McKinsey Global Institute found that knowledge workers spend 19 percent of their working week searching for and gathering information — 7.6 hours per week before adding configuration tasks (McKinsey Global Institute, 2012). For teams managing GA4, Meta Ads, Google Ads, a CRM, and attribution data simultaneously, 8 hours per week is the conservative baseline.
The Annual Drain by Team Size
Over 50 working weeks, that is 300 to 400 hours per person returned to strategic output. At a fully loaded rate of $60 per hour, that is $18,000 to $24,000 per analyst per year shifted from configuration work to campaign strategy.
These figures exclude the cost of delayed decisions made on incomplete data and the strategic opportunities missed while your team waits for dimension configurations to populate.
What You Can Do Right Now (No Purchase Required)
You do not need to rip out your existing stack to start moving faster. Here are three things you can do today inside GA4:
Audit your custom dimension usage. Go to Admin > Custom definitions. Check the Quota information counter. If you are above 60 percent of your limit, you will hit the ceiling within two quarters. Start planning your migration now.
Run the Google Sheet dimension audit. Download a free copy of the GA4 Custom Dimension Audit Template. Export your current dimension list via the GA4 API. Trace which dimensions actually drive reporting decisions and which are dead weight.
Track dimension delay cost. For one week, log every hour your team spends waiting for dimension data to populate. Multiply your fully loaded hourly rate against that lag. The number will be higher than any tool subscription you are paying.
3. What Is the True Cost of GA4's 50-Dimension Ceiling?
The Answer: GA4 standard properties carry a hard limit of 50 custom dimensions. Once your team reaches that ceiling, every new tracking requirement forces a trade-off: delete an existing dimension and lose its historical data, or upgrade to GA4 360, which starts at approximately $50,000 per year. Most teams hit this ceiling within 12 to 18 months of a mature GA4 implementation.
The 50-Dimension Ceiling in Practice
A mid-size e-commerce brand tracking product categories, content types, author IDs, campaign sub-types, user lifecycle stages, A/B test variants, and channel-specific parameters can exhaust 50 dimensions quickly. Each new product line, content vertical, or test framework requires a new dimension or forces a deletion decision.
Deleting a dimension does not remove historical data — but it removes your ability to segment by that dimension in future reports. The data exists. The access does not.
GA4 360 removes this ceiling and raises it to 125 event-scoped dimensions. But the entry price of $50,000 per year is an enterprise commitment made because a free tool's architecture forced the issue (Google, n.d.).
How DRA Compares to GA4 360
Capability | GA4 360 ($50k/yr) | DRA (Starts Free) |
|---|---|---|
Custom dimension limit | 125 event-scoped | No limit — schema introspection removes the need |
Data delay | 24-48 hour processing window | Real-time via Federated Query Layer |
Cross-platform joins | Manual via BigQuery | Automatic via Magic Joins |
Query interface | GA4 interface only | Plain English via AI Data Modeler |
Pricing floor | ~$50,000/year | Free for single users |
The Opportunity Cost of Configuration Lag
Every hour your team spends managing the 50-dimension ceiling is an hour not spent on copy testing, bid strategy, or audience segmentation. McKinsey research consistently finds that companies with automated data pipelines make decisions 40 percent faster than those relying on manual reporting cycles (McKinsey Global Institute, 2012). For a brand running $100,000 per month in ad spend, a faster decision on a failing creative saves days of wasted budget.
4. Why Does GA4 Force Your Best Strategists Into Data Entry?
The Answer: GA4's architecture shifts technical responsibility onto the user by design. The platform was rebuilt from Universal Analytics as an event-based system that places the burden of data structuring on the marketing team rather than on the platform. Every event, parameter, and custom dimension must be pre-registered before it produces usable reports. Your strategist becomes a data engineer by default.
The Developer-First Design Decision
Universal Analytics tracked sessions and pageviews with minimal configuration. GA4 replaced that with event-level tracking that captures hundreds of parameters per interaction but requires manual mapping before any parameter becomes reportable.
Gartner found that martech stack utilization dropped to 42 percent in 2022, down from 58 percent in 2020 (MarTech, n.d.). Teams are paying for tools they cannot fully use. The gap between tool capability and team capacity is filled with manual configuration work.
53 percent of marketing leaders now say their martech tools are a barrier to organizational alignment (MarTech, n.d.). The custom dimension architecture is a structural contributor to this statistic.
The CrowdFlower 2016 Data Science Report found that data professionals spend 60 percent of their time cleaning and organizing data. Only 9 percent goes to analysis and pattern mining (CrowdFlower, 2016).
Your team is not underperforming. Your infrastructure is assigning them the wrong work.
5. What Is the Alternative to Manual Dimension Mapping?
The Answer: The alternative is an intelligence layer that reads your data structure automatically without requiring you to register dimensions in advance. An AI data modeler performs schema introspection — it identifies your event parameters, infers their relationships, and makes them queryable in plain English without manual labeling. You ask a question. The system finds the answer. You do not configure a dimension. You do not wait 48 hours. You do not hit a ceiling.
Moving Beyond the Technical Maze
The goal is not to get better at managing custom dimensions. The goal is to remove the dimension management requirement entirely.
When an intelligence layer introspects your raw event schema, it eliminates the configuration step. Every parameter that exists in your data layer becomes immediately queryable. New campaigns, new product lines, and new tracking points do not require a dimension registration cycle.
Your team moves from a state of configuring access to data to a state of having access to data.
The Strategic Shift in Team Output
Before: Analyst spends Tuesday registering dimensions for the new product launch. Waits until Thursday for data to populate. Builds the report Friday. Presents Monday.
After: Analyst asks the intelligence layer a question in plain English on Tuesday morning. Receives a modeled answer in under 60 seconds. Presents Tuesday afternoon.
That time compression is not a minor efficiency gain. It is the difference between leading a launch and reporting on one after it ends.
6. How Does the DRA Truth Layer Restore Your Marketing Agility?
The Answer: The DRA Truth Layer uses automated schema introspection to make custom dimension configuration unnecessary. Our AI Data Modeler reads your GA4 event structure and ad platform data automatically. It joins GA4 events, Google Ads spend, and CRM records without manual mapping. You stop building dimensions. You start asking questions in plain English. Answers return in under 60 seconds. Your team acts on live facts instead of waiting for configuration cycles to complete.
What DRA Removes From Your Analyst's Day
The standard GA4 custom dimension cycle follows a predictable pattern: identify the need, register the dimension, wait for population, rebuild the report, present late. DRA eliminates this cycle at its origin.
AI Data Modeler: Ask a question in plain English. The engine reads your event schema, constructs the appropriate SQL, and returns a modeled answer in under 60 seconds. No dimension registration. No processing delay.
Magic Joins: DRA connects your Google Ads user ID to your CRM record without manual mapping. Relationships between your event data and your revenue data are inferred automatically. No VLOOKUP. No broken joins after a platform naming change.
Federated Query Layer: DRA queries GA4, SQL databases, and Ads platform data where it lives. You do not export, transform, or rebuild. You query directly. The 48-hour processing window that custom dimensions require becomes irrelevant.
CEO-Ready Reports: Dashboards load instantly via Nuxt 3 SSR. Public share links provide live access without login friction. Your numbers match your bank account before you walk into the boardroom.
Your Migration Path
DRA starts at Free for single users and $29 per month for teams at Starter. Migration takes under one hour: connect your GA4 property, and DRA introspects your schema automatically. No data export required. No reconfiguration of existing dimensions. You connect one source, ask one question, and validate the answer against what you already know. Then you scale from there.
Your Executive Certainty with DRA
DRA makes the technical layer invisible. Your Scientist brain has the precision it requires. Financial-grade numbers, verified, with no manual error introduced by configuration work.
Your Artist brain has the speed it needs. You pivot before the window closes. You test the hypothesis before the trend passes.
You stop acting as an IT support function for a broken dashboard. You lead.
FAQ
Q: Can I report on my data without registering custom dimensions in GA4? A: Not within the native GA4 interface. Any parameter you want to use as a report dimension must be pre-registered as a custom dimension. Data collected before registration is not retroactively segmentable by that dimension. An independent intelligence layer bypasses this requirement entirely by querying the raw event data directly.
Q: What happens when I hit the 50-dimension limit in GA4? A: You face three options: delete an existing dimension and lose future segmentation by it, restructure your tracking to consolidate parameters, or upgrade to GA4 360 at enterprise pricing. Most teams choose a combination of deletion and spreadsheet workarounds — both of which introduce manual error and reporting gaps.
Q: Is the 48-hour processing delay specific to custom dimensions? A: Both standard GA4 reports and custom dimensions carry a 24-to-48-hour processing delay. Custom dimensions add a separate delay: a new dimension does not begin populating until after registration, and the initial data takes additional time to appear in reports. Google's documentation confirms that recently collected data may change as processing completes (Google, n.d.-b).
Q: How much does DRA cost? A: DRA starts at Free for single users. Starter is $29 per month for teams. Professional is $129 per month. Professional Plus is $399 per month. Migration takes under one hour with no data export required. See full pricing and tiers.
Q: Does removing custom dimension dependency reduce data accuracy? A: No. An AI intelligence layer that performs schema introspection queries the same raw event data that GA4 uses. It does not sample the data. It does not introduce new configuration points. DRA uses PostgreSQL with Citus for columnar storage, which processes millions of rows in seconds without data sampling. The accuracy is the same. The configuration requirement is gone.
Q: Can a small team manage GA4 custom dimensions without a developer? A: A small team can manage basic custom dimensions without a developer — but every new tracking requirement still generates a configuration task that takes their attention away from campaign work. The ceiling problem remains regardless of team size. Teams that eliminate the configuration requirement entirely scale fastest, because their analyst capacity goes entirely to strategy.
Tactical Next Steps
Audit your current dimension usage. Run the GA4 Custom Dimension Audit Template. Know your ceiling distance before you hit it.
Track your team's configuration time. Log every hour spent on dimension registration, report rebuilding, and data validation. Calculate the annual cost.
Connect one source to an answer engine. Pick your biggest data gap — GA4, Google Ads, or your CRM. Connect it to a Federated Query Layer that answers questions in plain English. Then connect your marketing spend to revenue with one unified view instead of a dozen disconnected dashboards. Validate the answer against your bank account. Then scale from there.
Stop Configuring. Start Leading.
Stop configuring access to your own data. Start leading with certainty. Connect your marketing spend to revenue.
References
CrowdFlower. (2016). 2016 data science report. Archived at https://web.archive.org/web/20250117044233/http://visit.figure-eight.com/rs/416-ZBE-142/images/CrowdFlower_DataScienceReport_2016.pdf
Datorama / Salesforce Marketing Cloud Intelligence. (2019). Marketing data management study (surveyed 1,100 marketing organizations). Cited in: Salesforce. (2023). State of marketing (9th ed.). https://www.salesforce.com/resources/research-reports/state-of-marketing/
Google. (n.d.). Custom dimensions and metrics — Analytics Help. Google Support. https://support.google.com/analytics/answer/10075209
Google. (n.d.-b). Data freshness — Analytics Help. Google Support. https://support.google.com/analytics/answer/12233314
MarTech. (n.d.). Gartner: 40% of agentic AI projects will fail, making humans indispensable. https://martech.org/gartner-40-of-agentic-ai-projects-will-fail-making-humans-indispensable/
McKinsey Global Institute. (2012, July). The social economy: Unlocking value and productivity through social technologies. McKinsey and Company. https://www.mckinsey.com/industries/technology-media-and-telecommunications/our-insights/the-social-economy


