
Summary: Traditional dashboards show what happened but not what to do next. They create a 48-hour lag between a market signal and your decision. The next evolution of marketing technology replaces charts with direct answers. This article explains why dashboards are a bottleneck, how AI-powered platforms provide auditable answers, what guardrails prevent AI hallucinations, and how to start moving from dashboards to answers today — with a comparison table, 6-point FAQ, and a 3-step action plan.
Every morning you spend translating dashboard charts into boardroom decisions is a morning your competitor spent acting. The 48-hour report lag in tools like GA4 forces you to lead from the rearview mirror. You do not need more charts. You need answers. The next evolution of marketing technology is not better visualization. It is direct answers. This report identifies how to stop watching charts and start leading with factual certainty.
1. Why are traditional dashboards becoming a technical bottleneck?
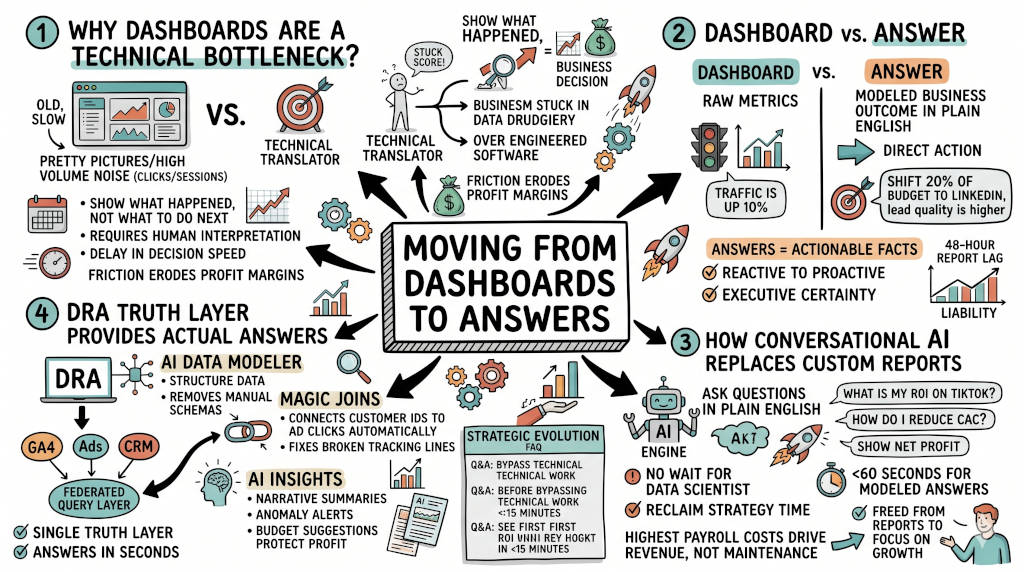
The Answer: Traditional dashboards show what happened. They do not tell you what to do next. Someone must interpret the chart, identify the pattern, and decide the move. This manual process creates a delay in your decision speed. You spend your morning as a technical translator for your own tools. That friction erodes your profit margins and prevents you from moving at market speed.
The trap of pretty pictures
You hired your team for their strategic brain. You did not hire them to operate dashboards. Most dashboards today report high-volume noise: clicks, sessions, impressions. They do not report net profit. This is data drudgery. It forces senior talent to act as data janitors for over-engineered software.
The real cost is not the tool subscription. It is the 400 hours a year your team spends maintaining reports instead of growing revenue (DRA, 2026).
2. What is the difference between a dashboard and an answer?
The Answer: A dashboard is a collection of raw metrics. An answer is a modeled business outcome delivered in plain language. A dashboard tells you traffic is up 10%. An answer tells you to shift 20% of your budget to LinkedIn because lead quality is higher. Answers move you from reactive to proactive. They provide the executive certainty required for boardroom success.
Moving to actionable facts
In a high-speed market, the distance between a signal and a move determines your profit. Dashboards carry a 48-hour report lag. This delay is a liability for your brand. You need current facts to out-pivot your competition. Answers remove the guesswork from your budget. They allow you to act with confidence every morning.
3. What happens when the AI gives you wrong answers?
The Answer: AI can give confident, articulate, completely wrong answers. It can hallucinate patterns that do not exist. It can celebrate bot traffic as a viral win. This is why guardrails matter more than the AI itself.
Why trust requires validation
Seer Interactive's team demonstrated this directly. Their analysts celebrated a traffic spike from ChatGPT. Their CEO asked follow-up questions in 30 seconds using conversational analytics. The spike was bot traffic. Without those questions, they would have optimized for garbage data (Lovett, 2026).
This means your answer engine must show its work. Every query must be auditable. Every number must be traceable to its source. If your platform hides the SQL, you are trading one black box for another.
Clevertouch Consulting's State of Martech 2025 research found that 96% of marketers say they are satisfied with their martech, but only a quarter have well-integrated systems. The single biggest barrier to AI adoption is data quality and disconnected platforms (King & Hall-Cooper, 2026). AI does not fix bad data. It amplifies it.
How DRA handles the trust problem
DRA does not hide the queries. Every answer is generated by our AI Data Modeler, powered by Gemini 2.0. The SQL is visible. The data lineage is traceable. Our Magic Joins show you exactly how spend connects to revenue. We built our platform for executives who need to defend every number in a boardroom.
4. How does conversational AI replace the need for custom reports?
The Answer: Conversational AI automates the SQL generation process. You ask a question in plain English. The intelligence engine models your raw data instantly and returns the truth. You no longer wait three days for a data scientist to build a custom report. You gain modeled answers in under 60 seconds. It restores your intellectual freedom.
Reclaiming your strategy time
Every minute your team spends building a report is a minute stolen from growth. You pay for high-level leadership but receive manual data entry. Removing this technical bottleneck frees your team to return to high-value strategy. It ensures your highest payroll costs drive revenue, not maintenance.
Sequel's analysis of marketing AI agents found that teams using conversational tools cut their brief-to-insight time by roughly half (Ahamad, 2026). The marketers who started using plain-English queries last year already moved faster than those still filing tickets for custom reports.
5. How does an AI-powered marketing decisions platform differ from a BI tool?
The Answer: A BI tool requires someone to model the data, build the dashboard, and maintain it. An AI-powered platform answers whatever you ask in the moment. It joins data across sources at query time. It does not need a pre-built report. It does not need a data engineer to add a new dimension.
The comparison that matters
Capability | Marketing Analytics Platform | AI-Powered Decisions Platform |
|---|---|---|
Pre-built dashboards | Yes | Optional |
Ad-hoc questions | Requires new report | Answer in seconds |
Skill required | SQL or modeled metrics | Plain English |
Data joins across sources | Modeled in advance | At query time |
Time to a new answer | Hours to days | Seconds |
Best for | Recurring KPI reviews | Investigative questions, weekly reports, anomaly detection |
Failure mode | Dashboards nobody opens | Queries needing human spot-check |
A common pattern in 2026 is to keep one or two leadership dashboards and route every other question through an AI agent. The dashboards anchor the review cadence. The agent handles the rest.
If you need an AI-powered marketing decisions platform that your CFO cannot argue with, the comparison above shows why it is time to move beyond dashboards.
6. How does the DRA Truth Layer provide actual answers?
The Answer: DRA uses a Federated Query Layer to join your GA4, Ads, and CRM data where it lives. Our AI Data Modeler uses Gemini 2.0 to turn your questions into modeled results instantly. Magic Joins connect your spend and revenue without manual mapping. This removes the technical tax on your focus. It provides a single Truth Layer that answers your toughest business questions in seconds.
What this means for your team
DRA gives you three things no dashboard can:
AI Data Modeler: We structure your data for you. No manual schemas.
Magic Joins: We connect your customer IDs to your ad clicks automatically. No broken tracking lines.
AI Insights: Narrative performance summaries and proactive anomaly alerts. The engine suggests budget shifts to protect your profit margins.
The technology is invisible. The answers are not.
7. How do you start moving from dashboards to answers today?
The Answer: You do not need to rip out your existing stack. You need one layer above it. Connect your data sources. Ask one question you could not answer yesterday. Validate the answer against what you already know. Then scale from there.
A three-step action plan
Connect one source. Pick your biggest data gap. GA4, Google Ads, or your CRM. Connect it to an answer engine.
Ask one cross-source question. "Which channel produced the highest profit last quarter?" requires joining spend and revenue. This is the question your dashboard cannot answer.
Validate the answer. Check the SQL. Trace the numbers. If they match your bank account, you have found your truth layer.
Seer's John Lovett recommends starting with a single-source pilot before expanding to enterprise-wide deployment (Lovett, 2026). Clevertouch agrees: pick a use case, build something small, and use it to show people what is possible when the data works (King & Hall-Cooper, 2026).
FAQ
Q: Should I stop using dashboards entirely? A: Stop using dashboards that require manual interpretation. Keep the ones that provide recurring pulse and trend monitoring. Route every other question through an answer engine.
Q: Do I need a data engineer to get answers? A: No. An AI-powered platform bypasses the technical work. You get results by asking questions in English.
Q: How do I know the answers are accurate? A: The platform must show you every query it runs. If you cannot see the SQL, you cannot trust the answer. DRA surfaces every generated query before execution.
Q: How long does it take to see my first answer? A: Most users see their first modeled ROI result in under 15 minutes with one connected source.
Q: What if my data is messy? A: AI does not fix bad data. It amplifies it. Clean one source first. Connect it. Validate the answers. Then add more sources.
Q: How is this different from GA4's built-in Intelligence panel? A: GA4 answers questions about GA4 data. An AI-powered answer engine reaches across GA4, Ads, CRM, and your warehouse. It answers questions no single tool can touch.
Stop acting as a technical translator for your own data. Lead your brand with certainty. Reclaim your team's billable hours and start winning today.
👉 Build your marketing decisions platform
References
Ahamad, M. (2026, June 8). AI agents for marketing analytics. Sequel Blog. https://sequel.sh/blog/ai-agents-for-marketing-analytics
Data Research Analysis. (2026). The invisible drain: 400 hours lost to data maintenance. DRA Internal Research.
King, O., & Hall-Cooper, S. (2026, February 26). The future of marketing intelligence: Part 1 - From dashboards to decisions. Clevertouch Consulting. https://clever-touch.com/learn/the-future-of-marketing-intelligence-part-1-from-dashboards-to-decisions
Lovett, J. (2026, March 27). The analytics infrastructure shift happening now: How conversational analytics is reshaping marketing intelligence. Seer Interactive. https://www.seerinteractive.com/insights/the-analytics-infrastructure-shift-happening-now-how-conversational-analytics-is-reshaping-marketing-intelligence