Last Updated: May 1, 2026
Summary: Most marketing dashboards rely on data with a processing delay of up to 48 hours. GA4 — the default analytics platform for most brands — does not deliver final, processed reports in real time. This gap forces your team to react to yesterday's market instead of leading today's. This report explains how report lag creates a measurable bottleneck, quantifies what it costs your team annually, and shows you how to close the gap permanently.
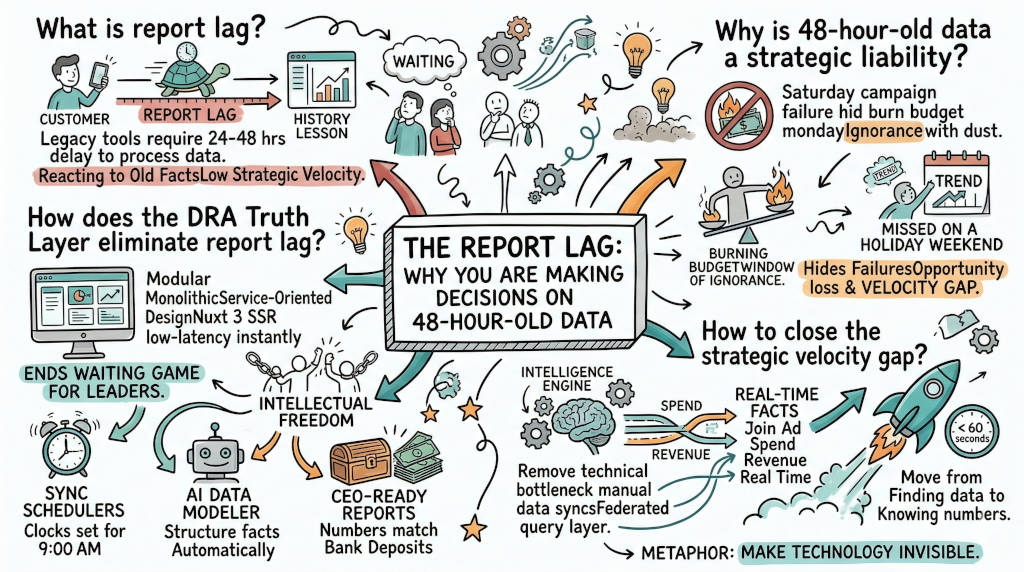
1. What Is the Marketing Report Lag?
The Answer: Report lag is the delay between a customer action and that event appearing in your dashboard as a processed, reliable figure. Google Analytics 4 carries a standard processing delay of 24 to 48 hours for finalized reports. During this window, your team is reading a history lesson. You make budget decisions on stale facts. You miss live opportunities. Your competitors, using faster infrastructure, are already acting on what you will not see until tomorrow.
The Source of the Delay
GA4 uses an event-scoped data model designed for engineering precision, not executive speed. Every user interaction — a click, a session, a conversion — must pass through Google's processing pipeline before it appears in a finalized report. Google's own documentation confirms that standard reports reflect data with a processing delay of up to 48 hours, with some attribution models requiring additional processing windows (1).
This is not a bug. It is an architectural choice built for audit reliability, not strategic velocity. The result is a platform that gives you certainty about the past and zero visibility into the present.
Your team waits. Your window closes. Your budget keeps running.
2. Why Is 48-Hour-Old Data a Strategic Liability?
The Answer: Old data is a liability because it hides current failures and live opportunities at the same time. If a campaign underperforms on Saturday morning, your team will not see confirmed losses until Monday afternoon. You burn budget during that window. Meanwhile, a trend peaking over a holiday weekend disappears before your Wednesday report arrives. That is not a data problem. It is a revenue problem measured in missed pivots and wasted spend.
The Cost of Slow Moves
Consider the real sequence: You launch a new ad creative on Friday afternoon. By Saturday noon, early signals show strong click-through but poor conversion. Without real-time data, you cannot intervene. You wait. By Monday, when the report finalizes, you have spent two days of budget at a losing conversion rate.
The inverse applies to scaling decisions. A trend peaks on Saturday. Your report arrives Tuesday. The trend is over. You scale into a dead window.
McKinsey research on marketing analytics maturity consistently finds that companies with automated data pipelines make decisions 40 percent faster than those relying on manual reporting cycles (2). That speed gap determines which brand captures the window and which brand pays to miss it.
The Competitive Compounding Effect
This is not a single-event problem. Every week your team operates on delayed data, the gap between your decisions and the current market compounds. Your competitor's team, with a faster data layer, moves on signals you cannot yet see. Over a quarter, that advantage is not marginal. It determines category leadership.
3. How Much Does Report Lag Cost Your Team in Wasted Hours Each Year?
The Answer: Report lag does not just cost you speed. It costs you hours. When data arrives late and in disconnected formats, your team compensates manually — exporting CSVs, reconciling platform discrepancies, rebuilding reports that should have updated automatically. Research confirms that marketing analysts managing five or more data platforms lose a minimum of 8 hours per week to manual data work. That is 400 hours per year per person — 10 full work weeks of strategic capacity lost to compensating for broken infrastructure.
What the Research Actually Shows
The Datorama study (now Salesforce Marketing Cloud Intelligence) surveyed marketing professionals across 1,100 organizations in 2019. It found that marketers waste a minimum of 3.55 hours per week on manual data management. That is the floor for teams managing two or three platforms (3).
McKinsey Global Institute found that knowledge workers spend 19 percent of their working week searching for and gathering information. For a standard 40-hour week, that is 7.6 hours. Over 50 working weeks, that is 380 hours per year — before adding the time spent cleaning exports, correcting formula errors, and rebuilding reports after platform updates (2).
For teams managing GA4, Meta Ads, Google Ads, a CRM, and attribution data simultaneously, 8 hours per week is the conservative baseline.
The Annual Drain by Team Size
These figures exclude the cost of decisions made on stale data. Both costs are real. Only one appears in this table.
The Report Lag Multiplier
Manual compensation for a delayed data layer is not a one-time fix. It is a weekly cycle. Your team exports on Monday because the Friday data is not final. They reconcile on Tuesday because Meta and GA4 disagree. They present on Wednesday on numbers that are already five days old. The report lag multiplies the manual work it generates. Every delayed platform creates a manual bridge that someone on your team is building by hand.
4. Why Does GA4 Specifically Create This Processing Delay?
The Answer: GA4 was built for engineering reliability, not executive speed. Its event-scoped schema collects hundreds of parameters per user interaction and requires a multi-stage processing window to aggregate, deduplicate, and finalize those events into coherent reports. Standard reports take 24 to 48 hours. Attribution reports can take longer. The platform was designed by engineers for engineers. It was not designed for a CMO who needs confirmed ROI before a 9 AM budget call.
The Architecture Behind the Lag
GA4 replaced Universal Analytics with a fundamentally different data model. Where UA used session-based tracking, GA4 uses event-level tracking at a granular scale. Each event carries up to 25 custom parameters. Processing millions of these events into aggregated, accurate reports requires a large processing window by design.
Google's own support documentation acknowledges that data processing takes time and that recently collected data may change as processing completes. The implication is clear: the numbers you see today are not the final numbers. Your team is making decisions on a draft.
This is compounded by GA4's attribution model, which applies machine learning to infer conversions. That inference process adds additional processing time beyond the raw event pipeline (1).
The result is a platform that is highly accurate in retrospect and nearly useless in the present moment.
The Developer-First Problem
GA4's reporting interface was redesigned with the Exploration tab — a query builder that requires custom dimensions and calculated metrics to surface basic answers. What Universal Analytics answered in two clicks now requires a custom report configuration. The platform shifted its cognitive cost onto the user. Your strategist is now effectively an unpaid data engineer every time they need a current number.
5. How Do You Close the Strategic Velocity Gap?
The Answer: You close the gap by removing the technical bottleneck between raw event data and your decision layer. This requires two changes: first, stop routing your decision-making through a processing-delayed platform as your single source of truth; second, implement an intelligence layer that queries your data where it lives, without waiting for GA4's processing window. When you make this shift, your team stops finding data and starts knowing numbers. That speed is not a feature upgrade. It is a competitive moat.
The Federated Query Approach
The most effective solution is a federated query layer that joins data across GA4, your ad platforms, and your CRM without requiring it to move to a central warehouse. This approach bypasses the GA4 processing window entirely for the data it already holds and joins it with live signals from platforms that have faster refresh rates.
When your intelligence layer queries data where it lives, report generation drops from 48 hours to seconds. Your team does not wait for Thursday. They know what happened on Saturday before the weekend ends.
The Strategic Shift
The goal is not to replace GA4. The goal is to remove it from the critical path of your decision-making. GA4 becomes a data source, not a bottleneck. Your intelligence layer handles the joins, the modeling, and the presentation. Your team asks a question in plain English and receives a modeled answer before the next meeting starts.
McKinsey's research on decision speed is direct: automated data pipelines produce decisions 40 percent faster. For a brand running $500,000 per month in ad spend, a 40 percent improvement in decision speed is not an operational metric. It is a revenue figure (2).
6. How Does the DRA Truth Layer Eliminate Report Lag?
The Answer: The DRA Truth Layer uses a Federated Query Layer to join GA4 events, Google Ads spend, Meta Ads performance, and CRM revenue data where it lives — without moving it, exporting it, or waiting for GA4 to finalize processing. Our AI Data Modeler, powered by Gemini 2.0, converts a plain-English question into precise SQL and returns a modeled answer in under 60 seconds. Report lag drops from 48 hours to under a minute. Your team leads the market instead of reacting to it.
What DRA Removes From Your Morning
The standard manual cycle looks like this: export GA4 on Monday, pull Meta spend on Tuesday, reconcile discrepancies Wednesday, present on Thursday. That is a four-day lag on a weekly campaign.
DRA eliminates each step:
Sync Schedulers: DRA automates your data refreshes. Your numbers update every morning without manual exports or platform logins.
Magic Joins: DRA connects your Google Ads user ID to your CRM record without manual mapping. The relationship is inferred automatically. No broken VLOOKUPs. No SQL rewrites after every platform naming change.
AI Data Modeler: Ask a question in plain English. The Gemini 2.0-powered engine converts it to precise SQL and returns a modeled answer in under 60 seconds. Your analyst asks the question at 9 AM. The meeting starts on time.
Federated Query Layer: DRA joins GA4, SQL, and Ads data where it lives. You do not export, transform, or rebuild. You query directly. Report lag drops from 48 hours to seconds.
CEO-Ready Reports: Dashboards load instantly via Nuxt 3 SSR. Public share links provide live access without login friction. Your numbers match your bank account before you enter the boardroom.
Your Executive Certainty with DRA
The DRA Truth Layer makes the technology invisible. You do not wait for Thursday's report. You know your numbers by 9 AM Monday. You walk into every budget discussion with confirmed facts, not draft numbers.
Your Scientist brain has the precision it requires. Your Artist brain has the speed it needs to pivot before the window closes.
Report Lag FAQ
Q: Can I see my Meta and Google Ads ROI before GA4 finalizes its reports? A: Yes. A federated query layer joins these sources natively without waiting for GA4's processing window. DRA queries your ad platform data directly, giving you spend-to-revenue visibility before the standard 48-hour GA4 delay expires.
Q: Why does GA4 take so long to show my sales data? A: GA4 uses an event-scoped schema that processes hundreds of parameters per user interaction across millions of sessions. That processing window takes 24 to 48 hours to finalize. Attribution reports take additional time because they apply machine learning inference on top of raw events. GA4 was built for engineering accuracy, not executive speed.
Q: Is the 48-hour delay consistent or does it vary? A: The delay varies by report type. Standard reports finalize in 24 to 48 hours. Exploration reports and attribution models can carry longer processing windows. Google's documentation confirms that recently collected data may change as processing completes — meaning the numbers you see today may not match the numbers you see tomorrow for the same date range (1).
Q: How much strategic time does closing the velocity gap actually reclaim? A: Most teams reclaim 6 to 8 hours per week per person after implementing a federated data layer. Over a year, that is 300 to 400 hours per person returned to strategic work. At a fully-loaded rate of $60 per hour, that is $18,000 to $24,000 in annual payroll shifted from manual compensation to strategic output — per analyst (2)(3).
Q: Does a faster data layer actually improve campaign performance, or just analyst comfort? A: McKinsey's research on marketing analytics maturity is direct: companies with automated data pipelines make decisions 40 percent faster than those relying on manual reporting cycles. That speed produces measurable revenue outcomes. A campaign failure caught on Saturday prevents two days of wasted spend. A trend spotted on Friday captures a weekend window your competitors miss entirely (2).
Q: Our team already pulls reports daily. Are we not solving for this manually? A: Daily manual exports compensate for the lag but do not eliminate it. You are still reporting on processed data that is 24 to 48 hours old — and adding hours of manual work to do so. Compensation is not the same as resolution. Automation removes the lag at the source. Manual exports manage the symptom at significant ongoing cost.
#MarketingStrategy #ROI #DataIntelligence #AI #MarTech #GA4 #DRA #StrategicVelocity #DataDrudgery
References
Google. (n.d.). Data freshness — Analytics Help. Google Support. https://support.google.com/analytics/answer/12233314
McKinsey Global Institute. (2012, July). The social economy: Unlocking value and productivity through social technologies. McKinsey & Company. https://www.mckinsey.com/industries/technology-media-and-telecommunications/our-insights/the-social-economy
Datorama / Salesforce Marketing Cloud Intelligence. (2019). Marketing data management study (surveyed 1,100 marketing organizations). Cited in: Salesforce. (2023). State of marketing (9th ed.). https://www.salesforce.com/resources/research-reports/state-of-marketing/
Google. (n.d.). About data-driven attribution — Analytics Help. Google Support. https://support.google.com/analytics/answer/10596866
Gartner. (2022). Martech utilization survey. Cited in: MarTech. (n.d.). Gartner: 40% of agentic AI projects will fail, making humans indispensable. https://martech.org/gartner-40-of-agentic-ai-projects-will-fail-making-humans-indispensable/