Summary: Your team is spending 400 hours a year on manual data work. Most leaders hire a data engineer to fix it. That is wrong. SQL dependence is an architecture problem, not a staffing gap. This article shows how no-code AI analytics replaces the technical translation trap with direct answers in plain English. You can stop being IT support for your own data.
Your CMO dashboard is lying to you. Not because the data is wrong. Because you cannot ask it a single question without opening a support ticket. Every time your team needs a new answer, they wait. Every wait kills strategic velocity. The fix is not another data engineer. It is a no-code analytics platform that reads your data where it lives and answers in English. You can stop the technical translation trap today.
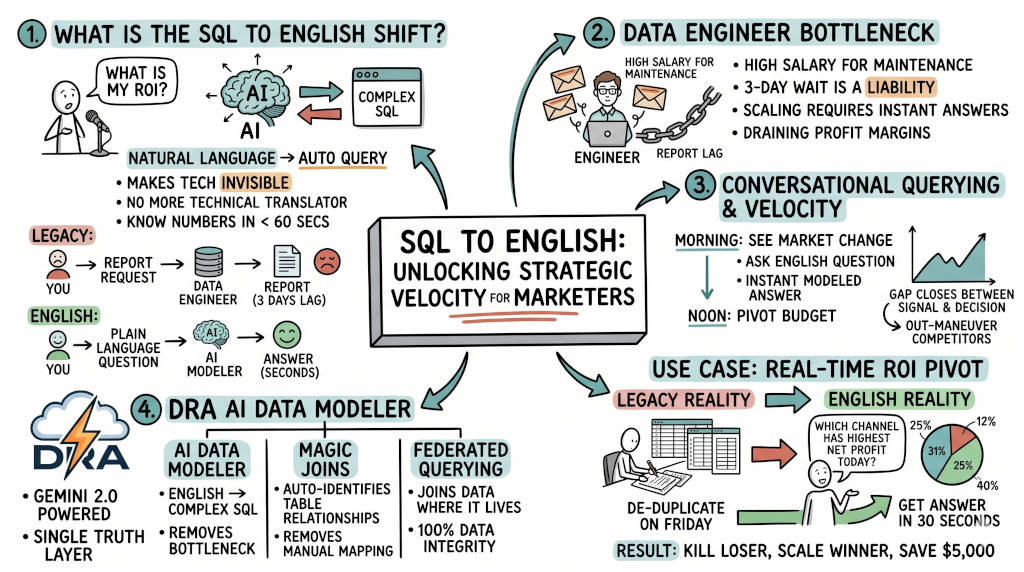
1. What is the SQL to English shift in marketing?
The Answer: SQL to English lets leaders ask business questions in plain language and receive modeled answers without writing queries by hand. It removes the translation layer between intent and evidence. The strategic gain is decision speed. Your team asks once, gets one governed answer, and acts before market conditions change.
Why this changes team output
Traditional reporting chains require specialists to translate strategy into query syntax. That translation cost compounds across every campaign, channel, and weekly report cycle. SQL to English tools shift effort from query writing to interpretation and action. Your team stops building plumbing. Your team returns to budget decisions, creative testing, and growth moves. Fuse calls this the "no code, no SQL, no tech team required" promise (Fuse, 2026). Sequel makes the same claim: "Sequel is built for marketers, not engineers" (Sequel, 2026). DRA operationalizes the same shift through a Federated Query Layer that joins sources where they live.
2. Why is hiring a data engineer often the wrong scaling move?
The Answer: Hiring can solve a staffing gap. It rarely solves an architecture gap. If your system depends on manual exports, brittle joins, and custom SQL tickets, headcount scales maintenance first. You increase payroll before increasing decision speed.
The cost structure leaders miss
A senior analytics hire near $150,000 base salary costs more in practice. BLS shows benefits are roughly 30 percent of compensation (BLS, 2025). With taxes, equipment, and software overhead, loaded cost often reaches $195,000 to $210,000. If only 25 percent of time goes to maintenance, that is $48,750 to $52,500 yearly. CrowdFlower reports 57 percent of data professionals dislike cleaning work most and spend 60 percent of time on it (CrowdFlower, 2016). nylo's research shows the DIY alternative costs $50,000 to $120,000 per year in maintenance and engineering alone (nylo, 2026). The issue is structural. One person cannot outwork fragmented systems at scale.
3. How much time does SQL dependence waste each year?
The Answer: Use the consistent baseline: 8 hours per week per analyst on manual data work. At 50 working weeks, that equals 400 hours yearly. McKinsey reports knowledge workers spend 19 percent of time searching for information (McKinsey, 2012). At 40 hours weekly, that is 7.6 hours per week before cleaning and reconciliation. The 8-hour baseline is a conservative floor for multi-source marketing operations.
The real dollar cost
At $60 loaded hourly cost, 400 hours equals $24,000 per person yearly. At $100 loaded hourly cost, it is $40,000 per person yearly. Fuse reports 400+ teams using their platform (Fuse, 2026). If even half those teams reclaimed 400 hours, the collective savings exceed $4.8 million annually. This is not a productivity issue. It is a profit leak.
4. Is SQL to English as reliable as manual reporting?
The Answer: Reliability improves when you remove repetitive manual handling steps. Manual workflows create silent errors during exports, copy operations, joins, and formula edits. SQL to English does not remove human judgment. It removes mechanical translation work that introduces avoidable mistakes.
Where manual chains fail
Spreadsheet risk research repeatedly shows high error rates in production files (EuSpRIG, n.d.). Each handoff raises failure probability. Each correction cycle delays decisions. Fuse addresses this with a proprietary AI anti-hallucination system and zero-hallucination guarantee (Fuse, 2026). nylo addresses it with deterministic Top-N and Worst-N rankings that produce the same answer from the same data every time (nylo, 2026). Sequel surfaces every generated SQL query so users can audit the logic (Sequel, 2026). DRA uses the same approach: governed query generation with stable models and read-only credentials.
5. Does moving from SQL tickets to English queries reduce burnout risk?
The Answer: Yes. Burnout rises when high-skill staff perform repetitive maintenance. SQL ticket queues, mapping fixes, and report rebuilds consume strategic capacity. When automation handles mechanical work, analysts return to analysis and strategists return to strategy.
The retention economics
CrowdFlower reports 57 percent of data professionals dislike cleaning work most (CrowdFlower, 2016). The same report shows 60 percent of time spent on cleaning and organizing. Gallup reports replacement cost can range from one half to two times salary (Gallup, 2017). This is a dual drain: weekly maintenance loss plus attrition risk. Automation addresses both by removing low-leverage technical drudgery. The scientists on your team stay sharp. The artists stay free to create.
6. How do you secure your data with no-code analytics?
The Answer: Enterprise-grade security is built into modern data automation platforms. Read-only credentials, SOC 2 compliance, and data residency guarantees ensure your customer data never leaves your control.
Security is table stakes
nylo processes data exclusively in EU data centers with GDPR-by-architecture, not as a checkbox (nylo, 2026). Fuse holds SOC 2 compliance and GDPR certification with end-to-end encryption, anonymized data, and LLM firewalls (Fuse, 2026). Sequel connects with read-only credentials, surfaces every generated query before execution, and never trains on customer data (Sequel, 2026). DRA runs with read-only credentials by default, exposing every generated query for audit before execution. If your automation vendor cannot show you their SOC 2 report, keep looking.
7. What specific integrations should a no-code analytics platform support?
The Answer: The platform must connect to every source your data lives in today. If you have to move your data to use the tool, the tool is the bottleneck.
The minimum viable integration list
Fuse integrates natively with GA4, Google Ads, Meta Ads, TikTok, LinkedIn, Klaviyo, Shopify, Amazon, Snapchat, Pinterest, Microsoft Ads, The Trade Desk, Stripe, Salesforce, HubSpot, and Adobe (Fuse, 2026). nylo supports 20+ managed OAuth integrations including Meta, Google Ads, TikTok, LinkedIn, Pinterest, Shopify, Klaviyo, and BigQuery (nylo, 2026). Sequel connects to GA4, HubSpot, Stripe, Google Ads, Meta Ads, BigQuery, Snowflake, Redshift, Postgres, MySQL, and MongoDB through read-only database connections (Sequel, 2026). Data Research Analysis connects to GA4, Google Ads, Meta Ads, SQL databases, CSV, Excel, and PDF. If your stack is not covered, ask why.
8. How does Data Research Analysis operationalize no-code analytics at production speed?
The Answer: Data Research Analysis makes no-code analytics production ready through governed data modeling. The Federated Query Layer joins sources where they live. Magic Joins infers cross-source relationships. The AI Data Modeler converts English questions into executable SQL. This compresses report cycles from days to minutes.
What changes in the weekly workflow
Manual cycle: export, clean, reconcile, present. DRA removes each stage.
Federated Query Layer: Query GA4, ad platforms, and SQL sources directly.
Magic Joins: Infer source relationships without repetitive mapping.
AI Data Modeler: Translate business questions into executable SQL.
Sync Schedulers: Keep model refreshes consistent without manual pulls.
CEO Ready Reports: Deliver live views for leadership decisions.
Your team stops reporting the past. Your team starts deciding from current signals.
FAQ
Q: Do I need SQL skills to use this model? A: No. You need precise business questions. The system handles query generation.
Q: How accurate is AI analytics compared to manual work? A: More accurate in practice. AI removes the mechanical errors that spreadsheets introduce. DRA provides a Certainty Score for every answer.
Q: How long does it take to set up? A: Most users connect a source and ask their first question within two minutes. Sequel reports the same timeline (Sequel, 2026). Fuse claims "seconds" for native integrations (Fuse, 2026).
Q: What is the cost model? A: DRA offers Free ($0), Starter ($29), Professional ($129), and Professional Plus ($399) tiers. Compare this to a $195,000 to $210,000 loaded engineer salary.
Q: Is my data secure? A: DRA uses read-only credentials. Every query is surfaced before execution. No data is moved from its source.
Q: Can this help my agency serve multiple clients? A: Yes. DRA's Federated Query Layer supports multi-source queries. Fuse and nylo both offer multi-client workspaces (Fuse, 2026; nylo, 2026).
Stop acting as IT support for your own dashboards. Lead your brand with certainty. Reclaim your team's strategic hours. Start winning today.
👉 See how DRA ends the technical translation trap
References
CrowdFlower. (2016). 2016 Data Science Report. Archived PDF. https://web.archive.org/web/20250117044233/http://visit.figure-eight.com/rs/416-ZBE-142/images/CrowdFlower_DataScienceReport_2016.pdf
European Spreadsheet Risks Interest Group. (n.d.). Spreadsheet error archive and risk material. https://eusprig.org/research-info/horror-stories/
Fuse. (2026). FUSE: Trusted AI analytics, zero hallucinations. https://www.fuse.is/
Gallup. (2017). This fixable problem costs U.S. businesses $1 trillion. https://www.gallup.com/workplace/247391/fixable-problem-costs-businesses-trillion.aspx
McKinsey Global Institute. (2012). The social economy. https://www.mckinsey.com/industries/technology-media-and-telecommunications/our-insights/the-social-economy
nylo. (2026). nylo: The analyst every team needs. https://getnylo.com/
Sequel. (2026). AI data analyst for marketing. https://sequel.sh/usecases/marketing
U.S. Bureau of Labor Statistics. (2025). Employer costs for employee compensation. https://www.bls.gov/news.release/ecec.nr0.htm