
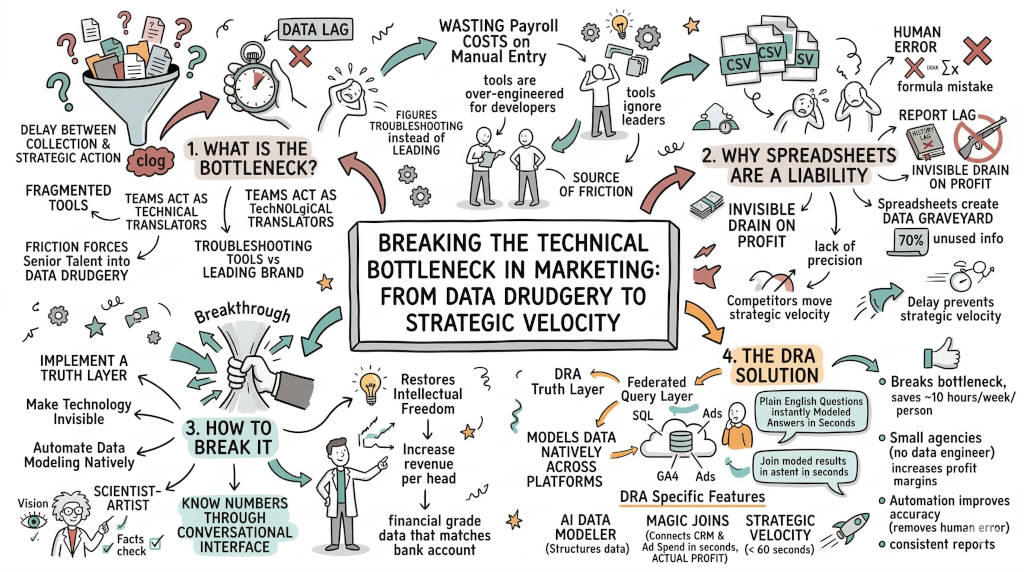
Summary: Spreadsheet errors cost marketing budgets an average of $4,315 per incident, with 53% of teams facing errors weekly and 88% of all spreadsheets containing at least one mistake (DOSS Research Team, 2026; Yates, 2017). The three most common errors — incorrect SUM ranges, numbers pasted as text, and broken VLOOKUPs — compound when budgets exist in 8 to 12 conflicting versions simultaneously. Spreadsheets offer no audit trail, no real-time visibility, and no governance. A federated intelligence layer eliminates these risks by connecting data where it lives, giving CMOs the financial-grade accuracy needed to defend budgets to the CFO.
Your team is spending 3.6 hours per week per person fixing spreadsheet errors. More than half of teams face spreadsheet errors every week (DOSS Research Team, 2026). That is 22 workdays a year lost to broken formulas, hidden rows, and numbers pasted as text. A single mistake costs $4,315 on average. Up to 88% of spreadsheets contain errors (Yates, 2017). Your annual marketing budget runs into the millions. A 2% error rate is not a typo. It is a seven-figure liability you are approving every quarter.
1. What is the real cost of spreadsheet errors in marketing budgets?
The Answer: The average spreadsheet error costs $4,315 per incident (DOSS Research Team, 2026). More than half of teams face errors every week. That adds up to 22 full workdays per year per employee spent fixing mistakes instead of growing revenue.
The $4,315 problem
DOSS surveyed 1,003 operations professionals (DOSS Research Team, 2026). They found that 53% deal with spreadsheet errors weekly. A single significant error costs $4,315. Up to 88% of all spreadsheets contain errors, with the most common being mechanical input mistakes, flawed logic in formulas, and data omission (Yates, 2017). These are not isolated typos. They are broken VLOOKUPs that under-order raw materials. They are hidden rows that sign contracts for assets the team never wanted. They are formula ranges that miss newly added budget lines.
Your CFO already suspects this. They see the budget variance. They just cannot prove where it came from.
2. Why are spreadsheets a liability beyond the obvious errors?
The Answer: Your budget exists in 8 to 12 conflicting versions at the same time. No single person knows which version is current. When the CFO asks who changed a number, nobody can answer.
The version control nightmare
Enterprise marketing budgets live in 8 to 12 spreadsheet versions simultaneously (Smartsheet, 2025). The Americas team has one version. EMEA has another. Demand generation has their own tracking sheet. None of them match.
The "final" budget is assembled by operations leaders spending hours manually reconciling conflicting files. This is not budget management. It is data archaeology.
The audit trail gap
Spreadsheets do not log changes. No user attribution. No timestamps. No approval workflow. If someone overwrites a cell or deletes a row, there is no trace. When the CFO asks for variance drivers, the honest answer is "we do not know." That is not a tool problem. It is a governance failure.
3. What are the most common spreadsheet errors that destroy budgets?
The Answer: Three errors cause most of the damage: incorrect SUM ranges when rows are added, numbers pasted as text that formulas ignore, and broken VLOOKUPs that fail silently.
Error 1: The missing row
Planful's analysis shows this is the number one mistake. A team adds a new agency line to the budget. They forget to extend the SUM formula. The new row sits outside the range. The total shows a lower number than reality. The agency gets paid anyway. The budget overruns without warning.
Error 2: Numbers as text
A team member copies figures from a PDF or a presentation. They paste into the spreadsheet. Excel stores the values as text. The SUM formula skips them. The budget shows a surplus. The actual spend is over by thousands.
Error 3: Broken lookups
A master procurement sheet uses VLOOKUP to pull lead times. Someone moves a column. The formula breaks silently. The team under-orders during peak season. Production stops. The company pays for expedited air freight.
4. How do you break the spreadsheet bottleneck for good?
The Answer: You replace manual spreadsheets with a federated intelligence layer that connects your data where it lives. You stop maintaining files. You start asking questions in plain English and getting modeled answers in seconds.
The Truth Layer approach
DRA uses a Federated Query Layer to join GA4, SQL, and Ads data without moving it. The AI Data Modeler converts your questions into SQL automatically. Magic Joins infer relationships between user IDs and email addresses. You get financial-grade data that matches your bank account.
No more VLOOKUPs. No more broken SUM ranges. No more guessing which version is current — the Technical Translation Trap ends here.
What your team gets back
Most teams reclaim 10 hours per week per head. That time goes into creative testing, campaign optimization, and market expansion. Your Scientist-Artist talent stops acting as data janitors. They start leading with strategy.
5. What does the CFO need before approving a new platform?
The Answer: The CFO needs an audit trail, real-time visibility, and proven governance. Spreadsheets offer none of these. A modern intelligence platform delivers all three.
The three CFO requirements
Audit trail: Every change is logged with user attribution and timestamps. When the CFO asks who changed a number, you show them the record.
Real-time visibility: Your budget updates continuously as teams execute campaigns. No more presenting last month's data as current reality.
Governance: Approval workflows are embedded in the system. Modifications above thresholds require sign-off. Routine updates flow without friction.
DRA gives you all three without requiring a data engineering team.
6. How do you check your spreadsheet for hidden errors right now?
The Answer: Run a 10-minute diagnostic. Check your SUM ranges, test your VLOOKUPs for silent failures, and audit your data types. If you find one error, assume there are more.
The 10-minute spreadsheet diagnostic
Open your master budget spreadsheet
Click each SUM cell and check the highlighted range. Does it include all rows?
Look for green corner markers in cells. Excel warns you about omitted adjacent cells
Check for numbers stored as text. Select a cell and check the data type in the formula bar
Run Excel's Error Checking tool in the Formulas ribbon
Ask your team: how many versions of this file are in circulation right now?
If any of these steps reveal an error, your budget has more. Spreadsheet errors cluster. Fixing one never fixes all of them.
FAQ
Q: How much does a single spreadsheet error really cost? A: DOSS research puts the average at $4,315 per significant error. For marketing budgets with millions in annual spend, a 2% error rate represents six-figure exposure.
Q: Can I trust automated tools more than my own Excel checks? A: Yes. Automated modeling removes the manual data entry, formula construction, and version control that introduce errors. DRA's AI Data Modeler converts questions to SQL. It does not misplace a decimal.
Q: How long does it take to migrate off spreadsheets? A: DRA connects to your existing data sources where they live. There is no migration. You stop maintaining spreadsheets and start querying your data through a conversational interface.
Q: Who typically needs to approve moving away from spreadsheets? A: The CFO and the CMO together. The CFO wants audit trails and governance. The CMO wants strategic velocity. DRA delivers both.
CTA
Stop approving budget variance as a cost of doing business. Stop being IT support for broken dashboards. See how DRA frees your team from the technical translation trap.
References
DOSS Research Team. (2026, May 14). Spreadsheet errors: How manual data mistakes are costing operations teams thousands. DOSS. https://www.doss.com/research/spreadsheet-error-costs-operations-thousands
Smartsheet. (2025, October 3). The hidden cost of spreadsheets. Smartsheet. https://www.smartsheet.com/content/hidden-cost-of-spreadsheets-report
Yates, I. (2017, July 26). 88% spreadsheets have errors. FP&A Trends. https://fpa-trends.com/article/88-spreadsheets-have-errors


