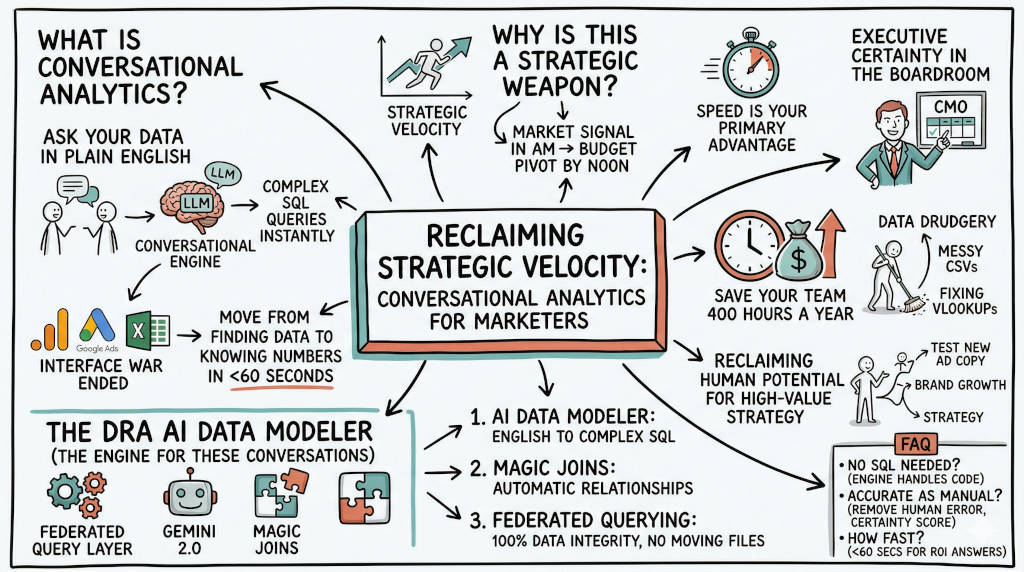
Summary: Your team is losing days to manual data work. Every answer you need requires an analyst ticket, a SQL query, or a spreadsheet export. Conversational analytics changes that. You ask in plain English and get grounded answers from your live data. No translation layer. No wait. This article shows what conversational analytics is, how it works, why most AI tools get the math wrong, and how DRA makes it production ready.
Your weekly leadership meeting is a waiting room. You see a number move. You ask why. The answer arrives three days later, after the decision window closed. This is not a staffing problem. This is a speed problem. Conversational analytics collapses the gap between question and answer. You can stop the technical translation trap and start deciding from current signals.
1. What is conversational analytics in marketing?
The Answer: Conversational analytics lets leaders query business data in plain English and receive modeled answers without writing SQL or opening a support ticket. It removes the translation layer between intent and evidence. The strategic gain is decision speed. Your team asks once, gets one governed answer, and acts before market conditions change.
Databox defines it the same way: "the ability to query your business data using plain-language questions and receive plain-language answers back" (Databox, 2026). The mental model shift matters. Traditional BI assumes you know what you want before you look. Conversational analytics flips that. You discover what you need by asking.
Why this changes executive behavior
Traditional analytics asks leaders to navigate tools built for specialists. Conversational analytics removes that step. Leaders focus on the business question. The engine handles query construction and data modeling. Analysts stop translating tool logic. They return to interpretation, scenario testing, and strategy.
2. How does conversational analytics actually work?
The Answer: A governed conversational analytics system works in three steps. You ask a question in plain language. The system translates it into a structured query against your live connected data. It returns a plain-language answer with context and supporting numbers. The LLM never touches your math.
This distinction matters more than any other feature decision.
Why most AI tools get the math wrong
There are two fundamentally different architectures. In most AI data tools, the LLM does the math. It reads your numbers, computes averages, and generates results. This is where hallucination happens. The model produces a statistically plausible answer based on patterns, not a retrieval from your live data. Databox warns: "ChatGPT...predicts what your metrics probably say based on training patterns" (Databox, 2026). Seer Interactive confirms: "AI will confidently give you wrong answers. It will hallucinate patterns that don't exist" (Seer Interactive, 2026).
In a properly built system, the LLM only generates language. The computation runs actual queries against your connected data. The model never touches the math. It translates your question, runs the query, and narrates the result.
DRA follows this architecture. The AI Data Modeler converts English into executable SQL. The Federated Query Layer runs against live GA4, ad platforms, and SQL sources. The result is a grounded answer with a Certainty Score. Not a prediction. A query result.
3. What questions can marketing leaders actually ask right now?
The Answer: You can ask any question you would ask an analyst. Campaign performance. Budget pacing. Trend investigation. Cross-channel comparison. The answer arrives in seconds, not days. Here are five real examples.
Campaign performance
Question: "Which channels drove the most pipeline last quarter?"
The old way required pulling channel attribution reports, adding ad platform data, and reconciling manually. That took two to three days. Conversational analytics returns the answer in seconds, broken down by channel with period comparison included.
Budget defense
Question: "What was our ROAS by channel in Q1 compared to Q2?"
The old way required finance to pull ad spend, marketing to pull revenue attribution, and someone to reconcile both. Three day turnaround. Conversational analytics returns the comparison with variance flagged in one query.
Trend investigation
Question: "Why did our conversion rate drop after the April campaign?"
Databox Genie shows what a real answer looks like: "Your overall conversion rate dropped from 3.2% to 1.9% in the 7 days following the April 3 campaign launch. Paid social traffic increased 41% but converts at 0.8% well below your 2.4% site average" (Databox, 2026). Suggested follow-up: compare the campaign landing page to top converting pages.
Budget pacing
Question: "What is our month-to-date ad spend by platform compared to plan?"
One question returns a breakdown by Google, Meta, LinkedIn, Microsoft against pacing targets with variance flagged. Follow up: "Split the Google spend into Search and YouTube." Done in under one minute.
Cross-team alignment
Question: "How does our CAC this quarter compare to last year?"
This only works if your team has one definition for CAC. If marketing and finance define it differently, the tool returns conflicting answers. Standardize definitions first.
4. Is conversational analytics as reliable as manual reporting?
The Answer: Reliability improves when you remove repetitive manual handling steps. Manual chains create silent failure points during exports, joins, and formula updates. A governed conversational analytics system standardizes how answers are generated. Leaders still own interpretation. The system removes mechanical translation work.
Where manual processes fail
EuSpRIG documents a long record of spreadsheet-driven failures across public and private institutions, including material financial losses and reporting errors (EuSpRIG, n.d.). Every manual handoff raises failure probability. Standardized query generation reduces that exposure.
Seer Interactive validates this through its own experience. Their team celebrated a traffic spike until conversational analytics revealed it was bot traffic. "Traditional measurement would have celebrated that spike. We would have written a case study about it" (Seer Interactive, 2026). The truth surfaced in 30 seconds.
The hallucination risk is real but avoidable
Seer built validation protocols based on Twyman's Law: "Any figure that looks interesting or different is usually wrong" (Seer Interactive, 2026). Their system flags metrics with more than 50% change period over period, conversion rates above 10% or below 0.1%, and traffic sources accounting for more than 80% of volume.
DRA uses a governed query generation approach with stable models and read-only credentials. Every query is surfaced before execution. The answer includes a Certainty Score so you know how much weight to give it.
5. What are the limits of conversational analytics?
The Answer: Three limits matter. Conflicting metric definitions break any tool. Data quality is the prerequisite, not a nice-to-have. Dashboards do not go away they serve a different job. Address these before deploying conversational analytics at scale.
The "three versions of CAC" problem
If your marketing team, finance team, and RevOps team each calculate CAC differently, a conversational analytics tool returns different answers to the same question. No one trusts it. Databox research found 48% of teams said a single standardized definition would most improve reporting trustworthiness (Databox, 2026). The semantic layer is the technical solution. Getting teams to agree on definitions is the organizational one.
Data quality is not optional
Conversational analytics surfaces what is in your data. It cannot fix incomplete, miscategorized, or stale data. Garbage in, garbage out still applies. Funnel emphasizes: "Trusted data begins with unification. When a conversational system pulls from disconnected platforms, it can misinterpret even simple questions" (Funnel, 2025).
Dashboards are not replaced
Dashboards track. Conversational analytics investigates. You need both. Databox states: "Dashboards do the tracking job showing the same metrics at the same cadence. Conversational analytics does the investigation job answering ad hoc questions when a metric moves" (Databox, 2026).
6. How do you start with conversational analytics without a data team?
The Answer: No engineering prerequisites. No data warehouse required. Follow these five steps and get to first value within a week.
Step 1: Connect your core data sources. Start with three platforms: your CRM (HubSpot or Salesforce), your primary ad platform (Google Ads, Meta), and your web analytics (GA4). These three answer most marketing performance questions.
Step 2: Standardize your five to ten most critical metric definitions. Agree on what CAC, MQL, and ROAS mean. One definition per metric shared across marketing and finance.
Step 3: Ask your most common ad hoc question first. Whatever your analyst gets asked most often, type it in plain language. Evaluate whether the answer matches what you expect.
Step 4: Follow up in the same conversation. After the first answer, dig one level deeper. "Break that down by channel." "Compare to last quarter." The context carries forward.
Step 5: Share the answer in your next leadership review. Instead of sharing a dashboard link with narration, share the plain-language answer with supporting data. The shift makes the value visible.
7. How do you secure your data with conversational analytics?
The Answer: Enterprise-grade security is built into governed data platforms. Read-only credentials, SOC 2 compliance, and audited query generation ensure your data never leaves your control.
DRA runs with read-only credentials by default. Every generated query is surfaced for audit before execution. No data is moved from its source. Funnel processes data with similar safeguards: unified and normalized marketing data with fast-fail recovery when APIs break (Funnel, 2025). Databox holds SOC 2 certification and connects with read-only credentials across 130+ integrations (Databox, 2026).
If your vendor cannot show their SOC 2 report, keep looking.
8. How does DRA operationalize conversational analytics at production speed?
The Answer: DRA makes conversational analytics production ready through governed data modeling. The Federated Query Layer joins sources where they live. Magic Joins infers cross-source relationships automatically. The AI Data Modeler converts plain English questions into executable SQL. This compresses report cycles from days to minutes.
What DRA removes from the weekly cycle
The manual cycle is predictable: export, clean, reconcile, present. DRA removes each stage.
Federated Query Layer: Query GA4, ad platforms, and SQL sources directly.
Magic Joins: Infer source relationships without repetitive mapping.
AI Data Modeler: Translate business questions into executable SQL.
Sync Schedulers: Keep model refreshes consistent without manual pulls.
CEO Ready Reports: Deliver live views for leadership decisions.
Your team stops reporting the past. Your team starts deciding from current signals.
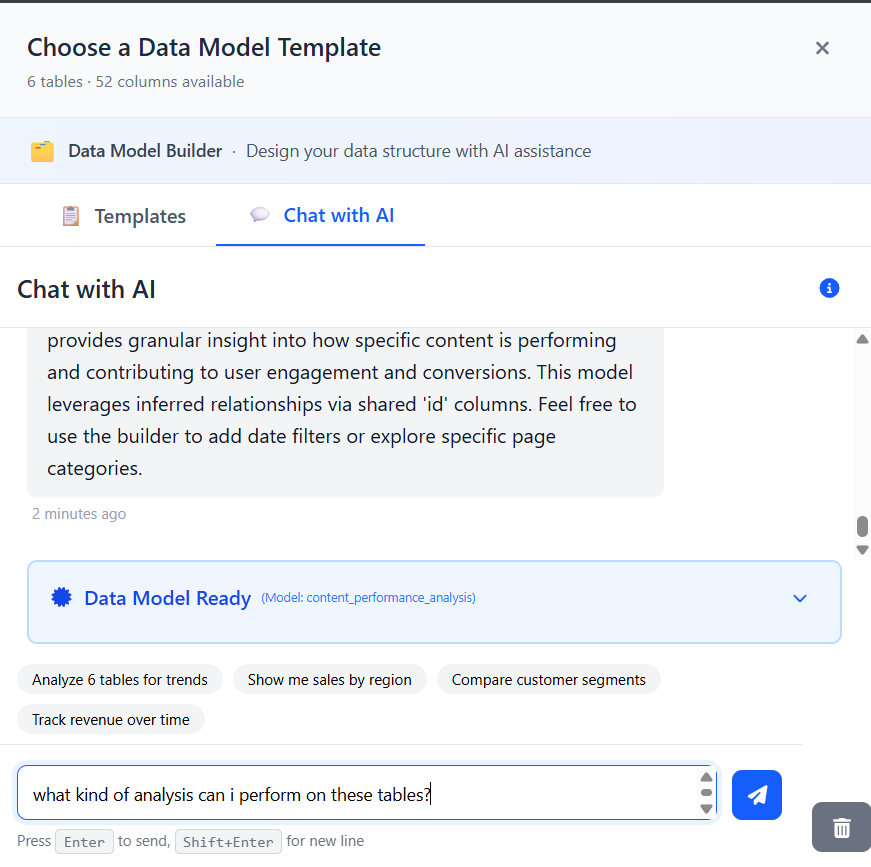
User's first question to the AI Data Modeler
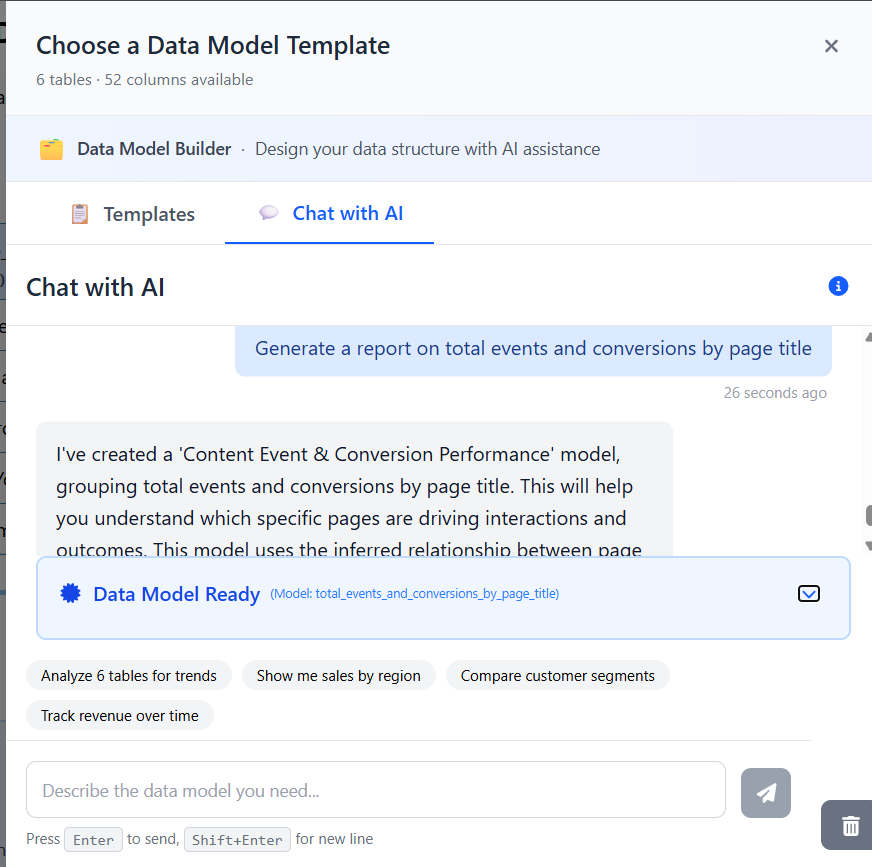
Analysis Returned By The AI Data Modeler
 AI Data Modeler One Button Model Generator
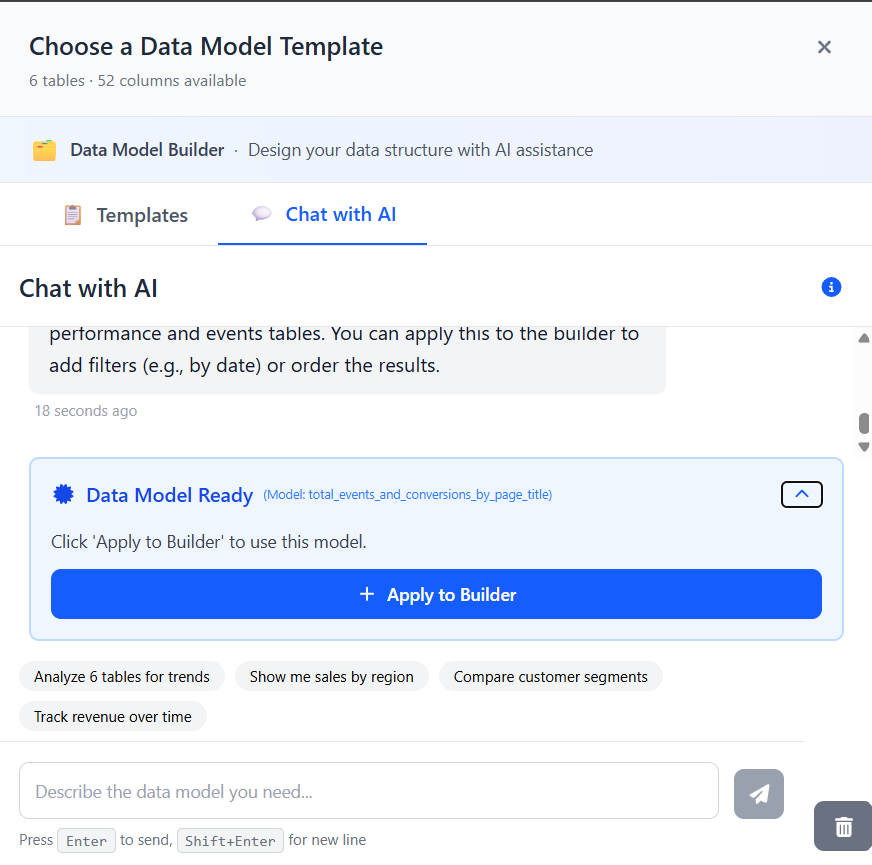
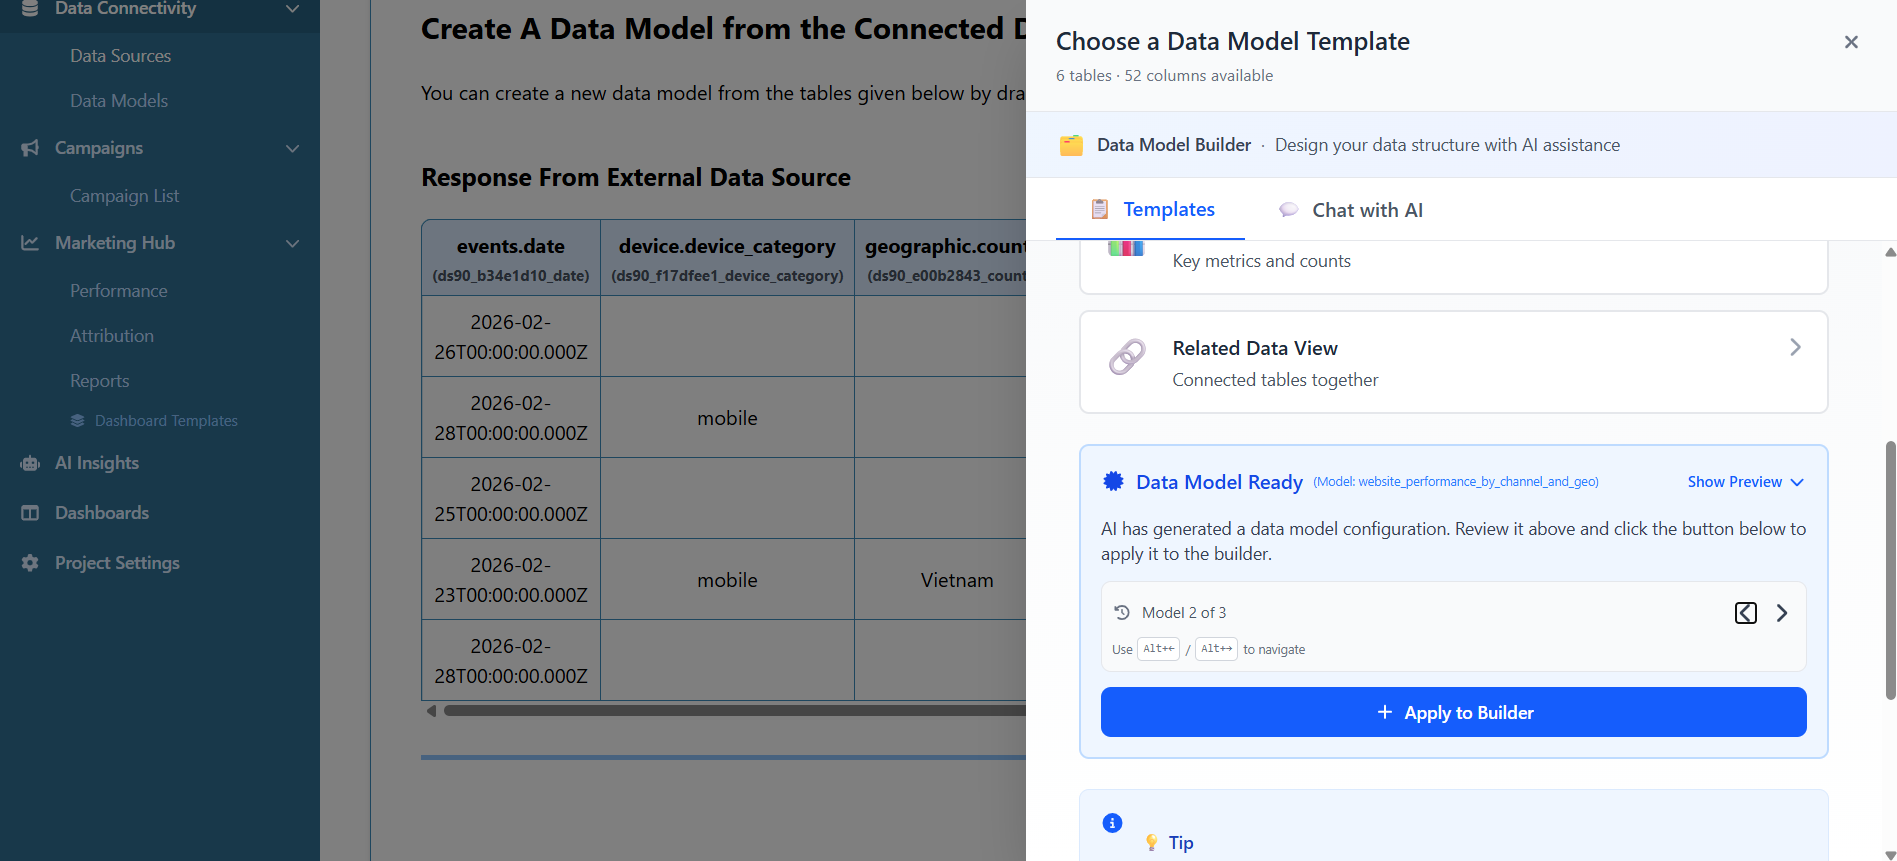
Data Model Build By The AI Data Modeler
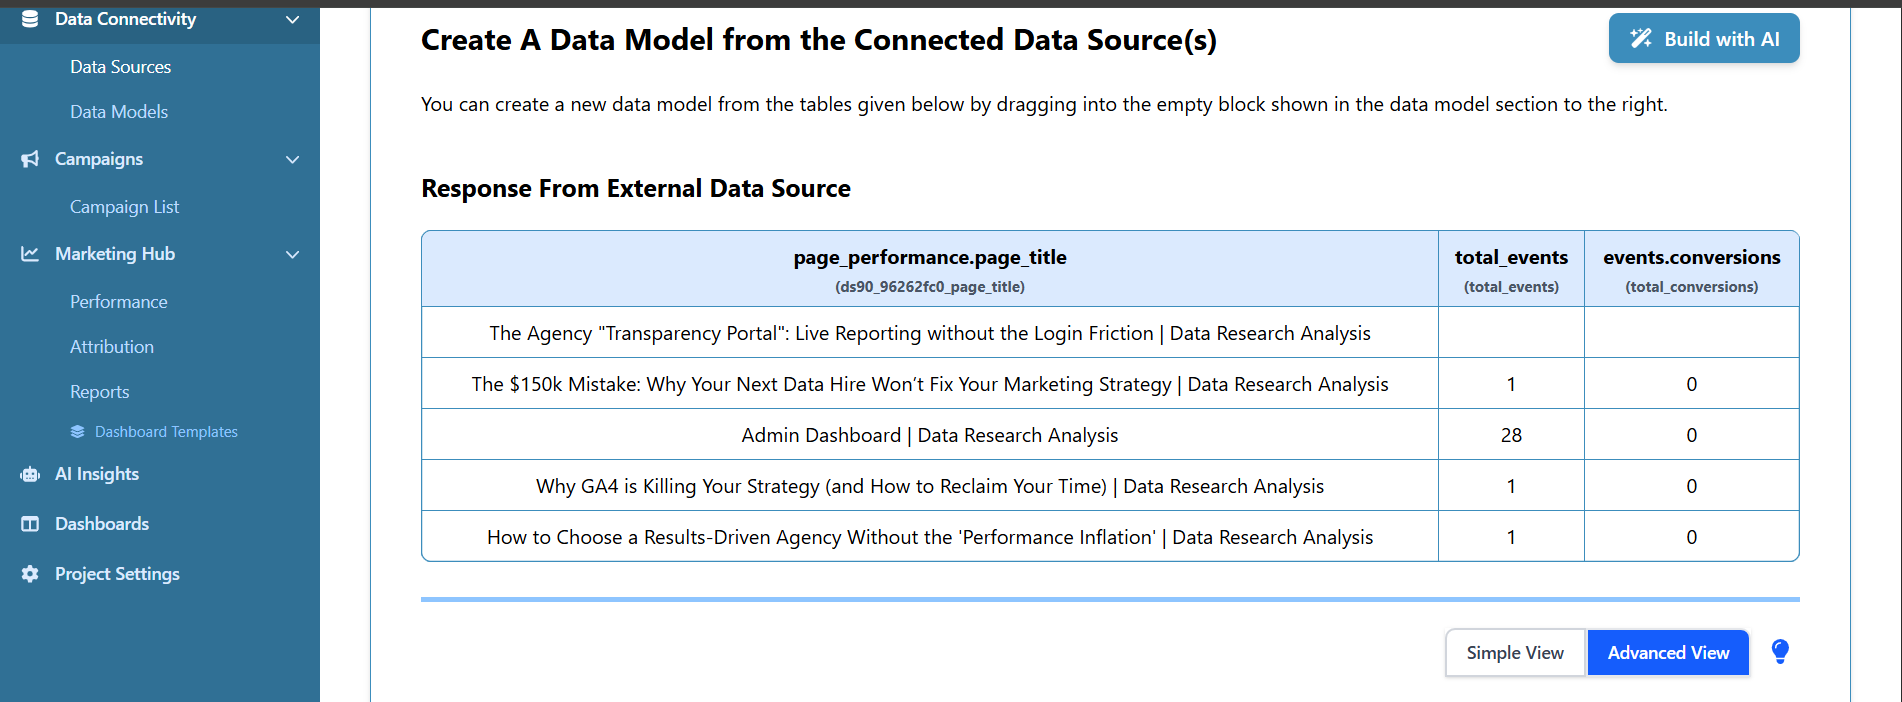 Data Model Applied With Results Showing
FAQ
Q: Do I need SQL skills to use conversational analytics? A: No. You need precise business questions. The system handles query generation.
Q: How accurate is AI analytics compared to manual work? A: More accurate in practice when the system follows the right architecture. AI removes mechanical errors. DRA provides a Certainty Score for every answer.
Q: Is GA4 still useful with conversational analytics? A: Yes. GA4 remains valuable. But GA4 lag means you need a faster decision layer.
Q: What is the corrected annual time loss baseline? A: 400 hours per person yearly at 8 hours weekly across 50 weeks. Funnel reports organizations using natural language querying cut time to insight by 68% (Funnel, 2025; Symbolic Data, 2025).
Q: What financial impact should I model first? A: Start with maintenance payroll. Use hours lost multiplied by loaded hourly cost.
Q: Is this only an agency problem? A: No. In-house teams face the same fragmentation and translation burden.
Stop acting as a technical translator for your own data. Lead your brand with certainty. Reclaim your team's strategic hours and start winning today.
Stop the technical translation trap
References
Databox. (2026). What is conversational analytics? A marketer's guide (2026). https://databox.com/conversational-analytics
European Spreadsheet Risks Interest Group. (n.d.). Spreadsheet error incident archive. https://eusprig.org/research-info/horror-stories/
Funnel. (2025). Conversational analytics is turning data into dialogue for smarter marketing decisions. https://funnel.io/blog/conversational-analytics
Seer Interactive. (2026). The analytics infrastructure shift happening now: How conversational analytics is reshaping marketing intelligence. https://www.seerinteractive.com/insights/the-analytics-infrastructure-shift-happening-now-how-conversational-analytics-is-reshaping-marketing-intelligence
Symbolic Data. (2025). Natural language querying report. https://www.symbolicdata.org/natural-language-querying/