
Summary: A marketing stack is the collection of tools your team uses to run, measure, and optimize campaigns. Most enterprise stacks have 5 or more tools that do not talk to each other. The result: manual data work, conflicting numbers, and no clear line from spend to revenue. This guide explains what a marketing stack needs to deliver, why most fail, and how to build one that gives you executive certainty.
1. What is a marketing stack?
The Answer: A marketing stack is the set of tools, platforms, and data connections your team uses to acquire customers, run campaigns, measure performance, and report results. In a healthy stack, every tool shares data with every other tool. In practice, most enterprise stacks are a collection of disconnected systems.
A marketing stack typically includes:
Ad platforms (Google Ads, LinkedIn, Meta, TikTok)
Analytics tools (GA4, Adobe Analytics)
CRM and sales platforms (Salesforce, HubSpot)
Attribution and reporting tools
Content and email platforms
The term "marketing stack" is often used interchangeably with "martech stack." Both describe the same thing: your technology toolset for marketing.
Why the term matters for enterprise buyers
When a CMO says "my marketing stack is broken," they mean the tools are not aligned. When a board asks "what is our marketing stack?" they want to know if the technology supports growth or blocks it. Understanding the definition is the first step toward fixing the problem.
2. What are the components of a marketing stack?
The Answer: A complete marketing stack has five functional layers: audience and data management, campaign execution, content management, measurement and analytics, and reporting and attribution. Most enterprises own tools in every layer but have no connection between them.
Layer 1: Audience and data management
Tools that collect, store, and segment customer data. CDPs, data warehouses, and CRM platforms live here.
Layer 2: Campaign execution and automation
Ad platforms, email marketing tools, and automation platforms that deliver campaigns.
Layer 3: Content management and distribution
CMS platforms, content creation tools, and distribution channels.
Layer 4: Measurement and analytics
Web analytics (GA4), product analytics, and channel-specific reporting.
Layer 5: Attribution and executive reporting
Tools that connect spend to revenue and produce board-ready reports.
The gap in most stacks is Layer 5. Enterprise teams have the first four layers covered. They lack the ability to connect the data and see the full picture.
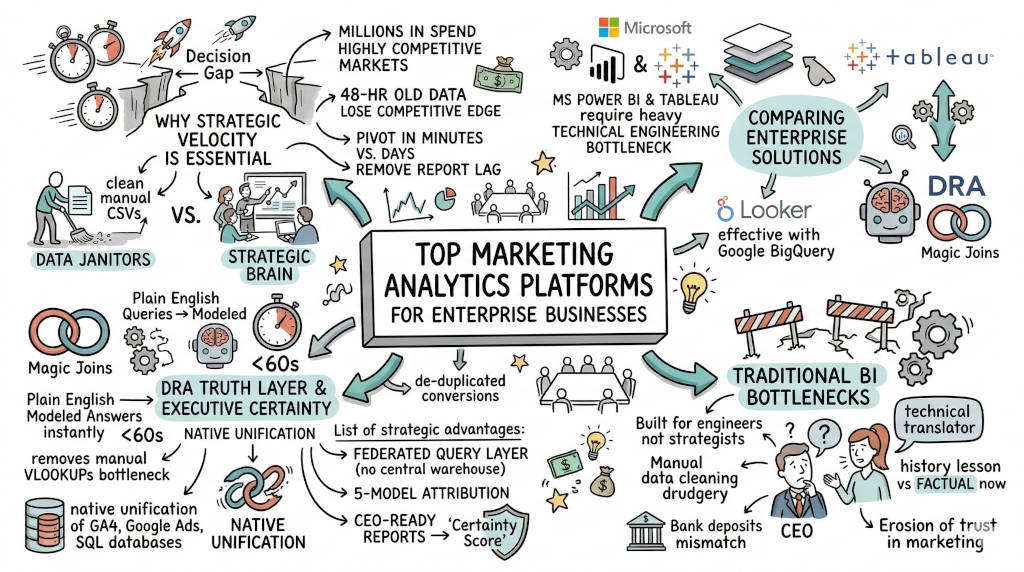
3. Why do traditional BI tools create a technical bottleneck for leaders?
The Answer: BI tools like Looker and Tableau are built for data analysts, not marketing leaders. They require SQL, data modeling, and ongoing maintenance. The average enterprise marketing team spends 400 hours per year on manual data work instead of strategy.
Traditional BI tools force a workflow that looks like this:
Export data from each platform
Join spreadsheets in Excel or Google Sheets
Build or update dashboards
Debug broken data connections
Present numbers that may not match the bank account
The Price of the Decision Gap
Every 48-hour lag in reporting is a missed opportunity. Competitors who see signals in real time can pivot campaigns before yours even registers the change. The tool should serve the strategist, not the other way around.
4. How to build a marketing stack that works
The Answer: Start with the data layer, not the tool layer. A stack built on integrated data performs better than a stack built on best-in-class point solutions that do not connect. Integration matters more than selection.
Step 1: Audit your current tools
List every platform your team uses. Note which ones share data automatically and which require manual exports.
Step 2: Identify the data gaps
Find the metrics that matter to your board but require manual assembly. The cost of inaction is measurable here.
Step 3: Choose a unified layer
Replace the manual join process with a platform that connects every source automatically. This is where DRA enters.
Step 4: Set up cross-channel measurement
Five attribution models running on the same data set. Compare last-touch, first-touch, linear, time-decay, and data-driven from one source.
Step 5: Automate reporting
Eliminate manual maintenance. Your team should spend zero hours on data preparation.
5. What are the top marketing analytics platforms for enterprise businesses?
The Answer: The enterprise marketing analytics market includes general BI platforms (Looker, Tableau, Power BI), marketing-specific tools (DRA, Supermetrics, Fivetran), and all-in-one platforms (HubSpot, Salesforce Marketing Cloud). Each category serves a different purpose, and most enterprises use tools from multiple categories.
Comparing Enterprise Solutions
Category | Examples | Best For | Limitation |
|---|---|---|---|
General BI | Looker, Tableau, Power BI | Data visualization | Requires engineering support |
Marketing Analytics | DRA, Supermetrics, Fivetran | Marketing-specific reporting | Varies by platform |
All-in-One | HubSpot, Salesforce | Unified marketing and sales | Limited customization |
DRA sits in the marketing analytics category but solves a problem the others do not. It connects data at the query layer rather than the export layer. This means no ETL pipelines, no middleware, and no manual joins.
The Problem with Manual Maintenance
Every platform in this comparison requires some level of manual setup. General BI tools need SQL queries and data modeling. Marketing analytics tools need connectors configured. All-in-one platforms need data imported from external sources.
DRA eliminates the maintenance layer entirely. Connect once. Query across every source. Report in minutes.
6. How does the DRA Truth Layer provide executive certainty for enterprise brands?
The Answer: The DRA Truth Layer is a Federated Query Architecture that joins data from every source without moving it. Google Ads data stays in Google Ads. GA4 data stays in GA4. CRM data stays in the CRM. DRA queries all of them as if they were one database.
Your Strategic Advantage with DRA
Federated Query Layer: One query across every source
5-Model Attribution: Compare all attribution models on the same data
AI Data Modeler: Convert English questions into SQL automatically
No-Code Interface: Marketing teams own the data, not engineering
Public Share Links: Live dashboards accessible without login
The result is executive certainty. When your board asks for the number, you do not schedule a follow-up meeting. You show them the live dashboard.
7. Why do most marketing stacks fail?
The Answer: Most marketing stacks fail because they are assembled tool by tool rather than designed as a system. Each tool solves one problem but creates a new one: data silos, incompatible attribution models, and manual overhead.
Three failure patterns
Tool proliferation: Teams add new tools without removing old ones. The average enterprise has 5+ tools.
Attribution mismatch: Each platform claims credit using its own model. None of the numbers agree.
Engineering dependency: Every report requires IT support. Decision velocity drops to zero.
53% of marketing leaders say their own tools are a barrier to alignment (Gartner, 2024). The problem is not the people. It is the architecture.
8. How to fix your marketing stack in 30 days
The Answer: A 30-day action plan that moves your team from manual data work to automated executive reporting. No new tools required in the first week.
Week 1: Discovery
List every platform your team uses
Map which data lives where
Identify the top 3 reports your board asks for most
Week 2: Connect
Connect your top 3 data sources to DRA (Google Ads, GA4, CRM)
Run the first cross-source query
Validate that numbers match your source platforms
Week 3: Measure
Enable 5-model attribution across all connected sources
Build your first cross-channel dashboard
Share it with your team using a Public Share Link
Week 4: Report
Replace your manual board report with a live DRA dashboard
Schedule automated data refreshes
Eliminate the 48-hour reporting lag
FAQ
Q: What is the difference between a marketing stack and a martech stack? A: They are the same thing. Both terms describe the collection of technology tools used for marketing operations.
Q: How many tools should a marketing stack have? A: Fewer than 5 integrated tools outperform 10 disconnected ones. Integration is more important than quantity.
Q: Can I build a marketing stack without SQL? A: Yes. DRA was built for marketing teams, not engineers. No SQL required for standard reporting and attribution.
Q: Why do my tools show different conversion numbers? A: Each platform uses its own attribution model. DRA runs 5 models on the same data so you see the full picture.
Q: What is the fastest way to fix a broken marketing stack? A: Stop adding tools. Connect the ones you already have to a unified query layer. Start with DRA.
Q: How long does it take to connect DRA to my existing stack? A: Most enterprise teams connect their first 3 sources and see cross-channel data in under one hour.
CTA
Stop managing a broken marketing stack. Connect every source, unify your data, and walk into your next board meeting with numbers that match the bank account. Start your plan with DRA.
References
Gartner. (2024). The State of Martech 2024: Marketing Leaders on Tool Alignment and Data Integration. Gartner Research.
Data Research Analysis. (2026). Connect Marketing Spend to Revenue: End the MarTech Stack Mess. Retrieved from https://www.dataresearchanalysis.com/connect-marketing-spend-to-revenue
Scott, D. M. (2023). The New Rules of Marketing and PR (8th ed.). Wiley.
Brinker, S. (2025). Martech 2025: The Marketing Technology Landscape. Chief Marketing Technologist Blog.


