
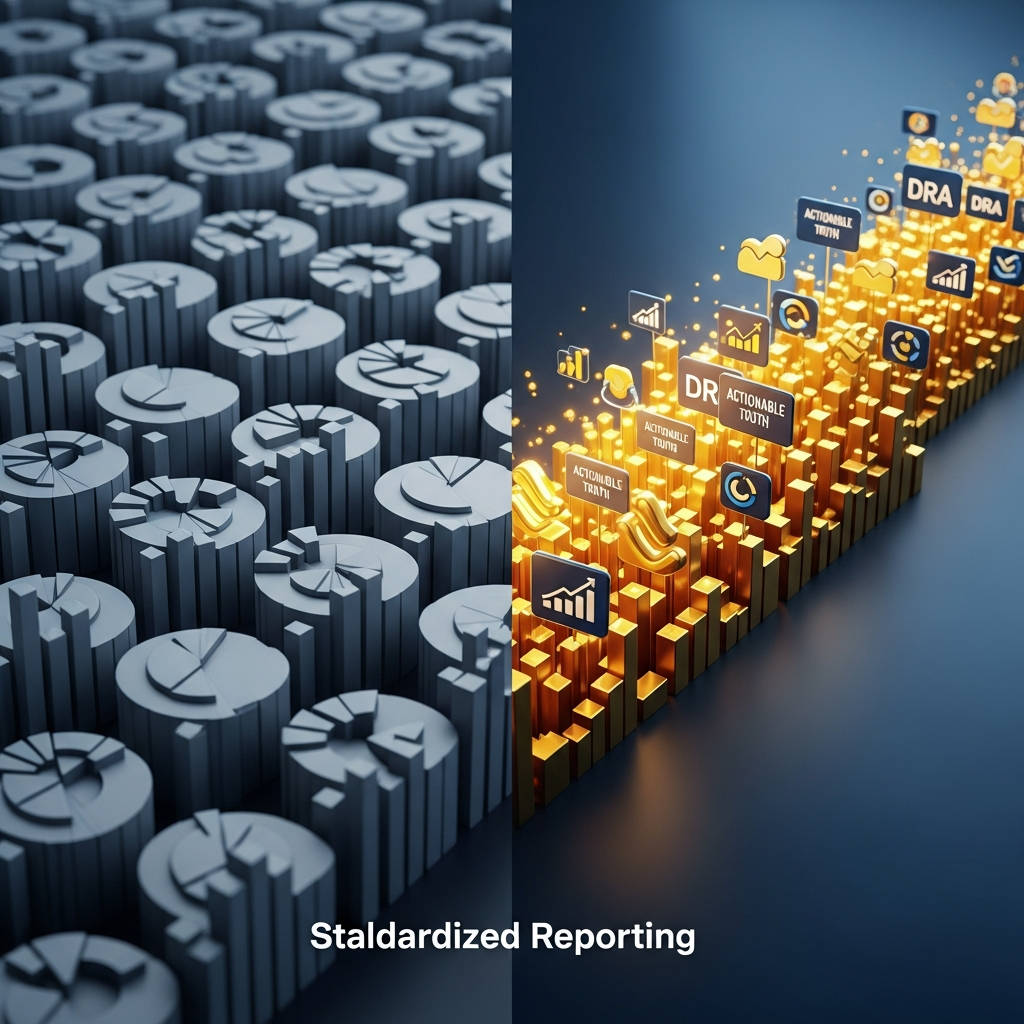
Summary: Standardized reporting templates force your team to use the same logic as every competitor. They hide profit-driving outliers behind blended averages and create a technical bottleneck that costs your team 400+ hours a year. This article covers the six hidden costs of template-based reporting, why average data produces average results, how the MarTech Stack Mess prevents you from seeing your real profit drivers, and a three-step fix you can apply today. If your dashboard looks like everyone else's, you are already falling behind.
The cost of inaction: Your dashboard shows a blended CPA of $50. One ad set converts at $5. Another bleeds at $200. The template hides both. You keep funding the loser. You starve the winner. This is not a data problem. This is a structural problem caused by the MarTech Stack Mess — 53% of leaders say their tools actively block alignment (Gartner, 2024). Every month you keep reporting from a standard template is a month you let averages hide your real advantage.
1. What is the real cost of standardized reporting templates?
The Answer: Standardized reporting templates cost you three things you cannot get back: strategic velocity, profit visibility, and team hours. They force your team to look at the same charts as every competitor. They hide extreme performers behind blended averages. And they require manual rework every time you need a question answered that the template designer did not predict.
A study by Citrin Cooperman found that 60% of finance and marketing teams spend more time gathering and validating data than analyzing it (Workday, 2024). McKinsey reports that marketing leaders waste 12 to 20 hours per week on manual data tasks (McKinsey, 2023). That is not reporting. That is data drudgery.
The Hidden Cost of Template Thinking
Standardized templates are not neutral. They are opinionated. The person who designed the template decided which metrics matter. If their priorities do not match your strategy, you are reading their map, not yours. A template designed for ecommerce ignores B2B lead velocity. A template designed for brand awareness hides direct response performance. You end up optimizing for what the template measures, not what drives your revenue.
2. How do dashboard templates create a technical bottleneck?
The Answer: Dashboard templates turn your marketing team into technical translators. Every time a stakeholder asks a specific question — "what was our Facebook ROAS last week for this specific product line?" — someone has to manually dig out the data. The bottleneck is not the question. The bottleneck is the tool.
Gartner found that 53% of marketing leaders say their technology stack is a barrier to cross-functional alignment (Gartner, 2024). This is the MarTech Stack Mess in action: too many point solutions, none of them connected, all of them generating reports that do not match each other. Google Analytics says 1,000 visitors. Your ad platform says 1,200 clicks. Your CRM says 45 leads. Nobody knows which number to trust.
The VLOOKUP Tax
Most teams solve this by exporting to spreadsheets and stitching data together manually. The process takes hours. It introduces formula errors. And by the time the report is ready, the data is already 48 hours old. A 48-hour lag means your competitors have already optimized. You are making decisions on history, not reality.
3. Why does average data produce mediocre results?
The Answer: Averages are the enemy of profit. Your average CPA of $50 does not tell you that one ad set converts at $5 and another bleeds at $200. The template shows the blended cost and calls it a day. You miss the chance to 10x your best channel. You keep funding your worst.
The same principle applies to attribution. Research by de Haan, Wiesel, and Pauwels found that last-click-based budget allocations yield 10% to 12% less revenue than multi-touch models (Innis, 2026). Industry analyses find that 30% to 60% of marketing spend is misallocated under single-touch attribution (Prooflytics, 2026). Your template is not just hiding data. It is hiding profit.
The Outlier Problem
Marketing profit lives in the extremes of your data set. A standard report shows a safe blended number. The $5 CPA channel that could scale to 10x your budget goes unnoticed. The $200 CPA channel that is draining your margin gets a free pass. You need modeled facts, not template defaults, to find your real profit drivers.
4. How do you fix standardized reporting without adding headcount?
The Answer: You fix it in three steps: audit, automate, and model. First, audit your current reports and identify every metric you track but never act on. Second, automate your data collection to eliminate manual exports and VLOOKUP chains. Third, model your data to your specific business goals instead of forcing your questions into a pre-built template.
Here is the practical checklist:
Audit every metric in your current reports. If you have not acted on a metric in 90 days, remove it. This immediately cuts report bloat by an average of 40%.
Eliminate manual data joins. Every export, every VLOOKUP, every copy-paste between tools is a failure point. Connect your data sources directly.
Define your profit metrics. Stop reporting what the template tells you to report. Define the three numbers that actually predict revenue in your business and build every report around them.
Free Resource: The 5-Step Reporting Audit Checklist
We built a practical checklist that walks you through the audit process. It covers how to identify hidden manual tasks, which metrics to cut, which to keep, and how to structure a profit-first reporting framework. You can download it below.
[Download the 5-Step Reporting Audit Checklist →]
5. What tools actually solve the MarTech Stack Mess?
The Answer: Most reporting tools — Looker, Google Data Studio, Tableau, Databox — are visualization layers that rely on you to build the logic. They do not solve the underlying problem. They dress it up in better charts. You still need to manually define every relationship, create every join, and write every query.
End the MarTech Stack Mess with DRA. Our Federated Query Layer joins GA4, SQL, and Ads data where it lives. Our AI Data Modeler converts plain English questions into complex SQL in seconds. Magic Joins automatically infer relationships between user IDs and emails across platforms. You stop configuring tools. You start getting answers.
AI Data Modeler: powered by Gemini 2.0. Reduces query time from hours to seconds.
Federated Query Layer: joins data without moving it. Eliminates data silos.
5-Model Attribution: run First-Touch, Last-Touch, Linear, Time-Decay, and U-Shaped models simultaneously on the same data set.
Public Share Links: share live dashboards with stakeholders. No login required.
FAQ
Q: Can I customize standard GA4 reports? A: Yes, but it requires manual work in the exploration tab. Every custom question needs a new configuration. DRA automates this modeling for you.
Q: How long does it take to move from templates to custom models? A: With automated data joins, your first custom model is live in minutes. Most teams see a full transition within two weeks.
Q: Does standardized reporting cause team burnout? A: Yes. The practice of manually stitching data across platforms costs teams 400+ hours per year. That time is spent on data drudgery, not growth strategy.
Q: How does DRA compare to Google Data Studio or Looker? A: Those tools require you to define your data logic manually. DRA infers it automatically. They are visualization tools. DRA is a modeling engine.
Q: What if my data lives in multiple platforms? A: DRA's Federated Query Layer joins data where it lives. No exports. No ETL pipelines. No data movement.
Q: Do I need a data scientist to use this? A: No. The AI Data Modeler translates English questions into SQL. Your team asks questions in the language they already use.
CTA
Download the free 5-Step Reporting Audit Checklist and start moving beyond template-based reporting today. Download the 5-Step Reporting Audit Checklist
References
Boathouse. (2026). CMO CEO study: The growing disconnect between marketing leadership and the C-suite. https://boathouseinc.com
Data Research Analysis. (2026). Unified marketing analytics platform. https://dataresearchanalysis.com
Gartner. (2024). Marketing technology survey: The barriers to alignment. https://www.gartner.com
Innis, M. (2026). Multi-touch attribution: Moving beyond last-click to maximize marketing ROI. https://prooflytics.com
McKinsey & Company. (2023). The data-driven marketing organization: Unlocking growth through analytics. https://www.mckinsey.com
Prooflytics. (2026). Marketing spend misallocation: The hidden cost of single-touch attribution. https://prooflytics.com
Workday. (2024). Finance teams and data gathering: A survey of workplace efficiency. https://www.workday.com


