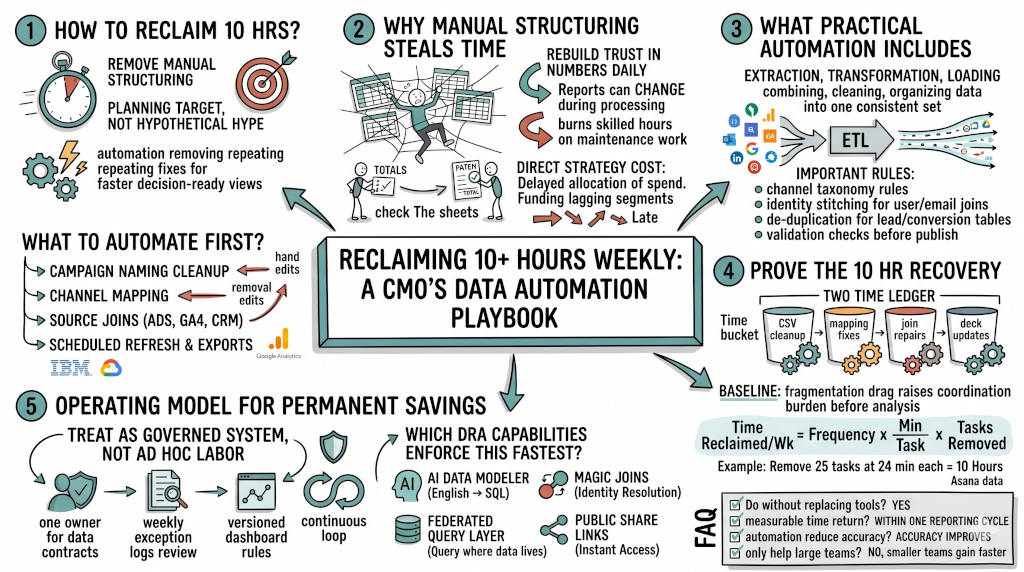
Summary: This article shows CMOs how to reclaim ten weekly hours by automating data structuring across extraction, cleaning, joining, and reporting. It frames time recovery as a measurable operating target, not hype, and explains why manual workflows create costly delays when GA4 data updates shift throughout processing windows. The piece outlines a practical rollout sequence, governance model, and proof method using a two week time ledger. It also provides a clear formula to calculate recovered hours from removed tasks. The central argument is simple: faster, cleaner data operations increase strategic velocity, improve decision timing, and free teams for revenue focused work.
1. How can a CMO target reclaiming 10 hours a week from reporting work?
The Answer: You can target 10 hours by removing manual structuring work. This is an internal planning target, not a universal benchmark. The fastest win is workflow automation across extraction, cleaning, joining, and publishing. Google confirms reporting data can shift during processing windows. That delay creates rework. Structured automation removes repeat fixes and gives decision ready views sooner.
What should be automated first for immediate weekly time return?
Start with campaign naming cleanup and channel mapping. Then automate source joins across ads, GA4, and CRM. Next automate scheduled refresh and executive exports. This sequence removes hand edits first. Hand edits are where weekly hours disappear.
Source: Google. (n.d.). [GA4] Data freshness. Google Analytics Help. Retrieved May 7, 2026, from https://support.google.com/analytics/answer/11198161 IBM. (n.d.). What is ETL (extract, transform, load)? IBM Think. Retrieved May 7, 2026, from https://www.ibm.com/think/topics/etl
2. Why does manual data structuring keep stealing execution time?
The Answer: Manual workflows force your team to rebuild trust in numbers daily. Google states data processing can take 24 to 48 hours. During that window, reports can change. Teams then recheck totals and patch sheets. That cycle delays campaign decisions and burns skilled hours on maintenance work.
What is the direct strategy cost of that delay?
Delay cuts your ability to reallocate spend during live performance shifts. You react after the move, not during it. Competitors with cleaner pipelines move budget first. You keep funding lagging segments while the market changes.
Source:
Google. (n.d.). [GA4] Data freshness. Google Analytics Help. Retrieved May 7, 2026, from https://support.google.com/analytics/answer/11198161
3. What does automated data structuring include in practical terms?
The Answer: Automated structuring means your pipeline performs extraction, transformation, and loading on a defined schedule. IBM describes ETL as combining, cleaning, and organizing data into one consistent set. Modern ETL tools also automate flow steps end to end. That reduces formatting effort and improves operating speed.
Which rules matter most for marketing reporting accuracy?
Use strict channel taxonomy rules. Add identity stitching rules for user and email joins. Add de duplication rules for lead and conversion tables. Add validation checks before dashboard publish. These rules protect decision speed and executive confidence.
Source: IBM. (n.d.). What is ETL (extract, transform, load)? IBM Think. Retrieved May 7, 2026, from https://www.ibm.com/think/topics/etl
4. How do we prove a 10 hour recovery is realistic?
The Answer: Use a two week time ledger and compute the target directly. Track recurring manual tasks. Typical buckets include CSV cleanup, mapping fixes, join repairs, and deck updates. Then automate each bucket and remeasure. Your proof is hours returned to planning and optimization. Keep this ledger visible in weekly leadership reviews.
Example model for a 10 hour target: Time reclaimed per week = frequency x minutes per task x tasks removed. If your team removes 25 tasks at 24 minutes each, you recover 10 hours.
What baseline can anchor urgency for leadership?
Asana reports leaders lose 3.6 hours weekly to unnecessary meetings. It also reports workers use 62 apps daily. Fragmentation raises coordination drag before analysis even begins. Automated structuring reduces this switching burden inside reporting workflows.
Source:
Asana. (2023). The anatomy of work global index. Retrieved May 7, 2026, from https://asana.com/resources/anatomy-of-work
5. What operating model keeps the time savings permanent?
The Answer: Treat structuring as a governed system, not ad hoc analyst labor. Define one owner for data contracts and mapping standards. Review exception logs weekly. Ship dashboard updates through versioned rules. This model prevents regression into spreadsheet firefighting and protects strategic velocity quarter after quarter.
Which DRA capabilities enforce that model fastest?
Use AI Data Modeler for English to SQL generation. Use Magic Joins for identity resolution. Use Federated Query Layer to query data where it lives. Use Public Share Links for instant executive access. These reduce translation work and speed decision cycles.
FAQ
Q: Can we do this without replacing every existing tool? A: Yes. Start with federation and automation across current systems.
Q: How long until leadership sees measurable time return? A: Most teams see clear change within one reporting cycle.
Q: Will automation reduce reporting accuracy? A: Accuracy improves when rules replace manual formatting steps.
Q: Does this only help large teams? A: No. Smaller teams gain faster because capacity is tighter.