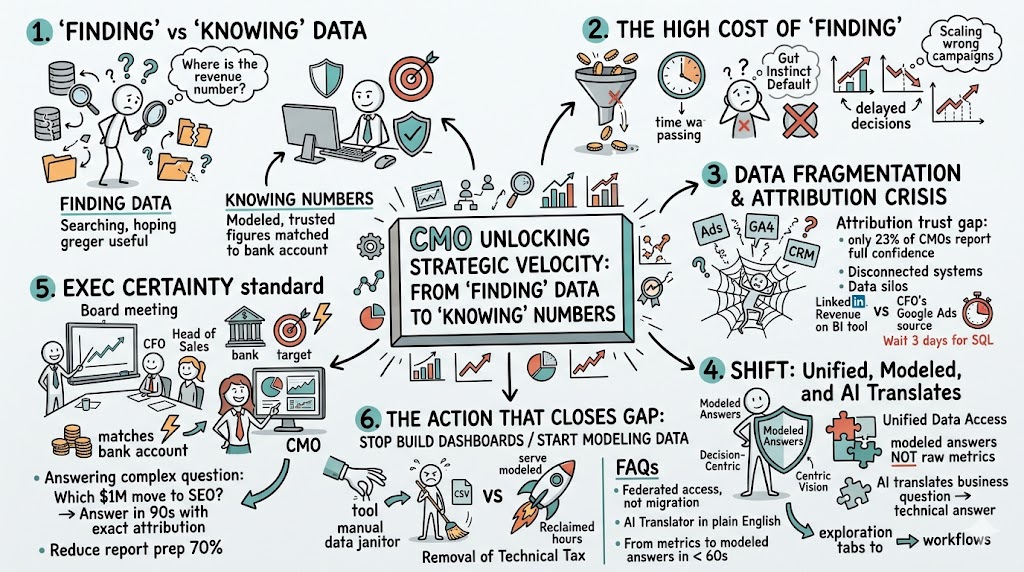
Summary: The shift from "finding" data to "knowing" your numbers addresses the critical gap between searching for information and having trusted, modeled answers. Workers waste 3.2 hours weekly searching — 166 hours annually per person — costing enterprises millions. Data silos mislead decision-making, with only 23% of CMOs fully trusting their attribution numbers. The solution requires unified data access, modeled business answers, and AI-powered insights. Organizations using federated architectures reduce report preparation by 70% and eliminate manual reconciliation. The path forward: stop building dashboards, start modeling data into action-ready intelligence. The cost of inaction is eroded executive trust and competitive disadvantage.
You spend 3.2 hours per week finding numbers you already own. That is 166 hours per year per person — four full-time employees doing nothing but looking for data that already exists. Your competitors move at the speed of their strategy. You move at the speed of your spreadsheets. The gap between finding data and knowing your numbers is the gap between staying relevant and falling behind.
1. What is the real difference between "finding" data and "knowing" your numbers?
The Answer: Finding data means searching through dashboards, exporting CSVs, and reconciling mismatched reports. Knowing your numbers means having modeled answers that match your bank account, available in seconds. The gap between these two states costs Fortune 500 companies an estimated 2.4 billion lost hours per year.
The search tax nobody budgets for
The average marketing professional spends 3.2 hours per week just searching for information they already have (13). Across a 50-person team, that is 8,320 hours annually. Atlassian's State of Teams 2025 report confirms teams lose roughly 25% of their workweek to information search, which compounds into an estimated 2.4 billion lost hours per year across Fortune 500 companies (1). In the UK alone, workers waste nine hours per week finding data they need to do their jobs (1).
Quickbase's 2025 Gray Work Report surveyed 2,200 professionals and found 59% spend over 11 hours per week chasing information from disconnected systems. Half spend only 50% of their week on meaningful work. The rest is "Gray Work" — manual tasks, data hunting, and fixing broken processes (13).
This is not a technology failure. Your data exists. You just cannot get to the answer fast enough to act on it.
2. Why does fragmented data actively mislead your decisions?
The Answer: Fragmented data does not just slow you down. It lies to you. When your ad platform reports one number and your CRM reports another, someone has to decide which version of reality to trust. Usually, that person is the one with the loudest voice — not the most accurate data.
The attribution trust gap
Gartner analysis found only 23% of CMOs have full confidence in their marketing attribution numbers (5). That means 77% of marketing leaders make budget decisions on data they do not fully trust.
Fluidata reports 81% of IT leaders say disconnected systems are their single biggest barrier to digital transformation (3). IBM's 2024 Chief Data Officer Study confirms 83% of businesses say data silos directly hinder real-time analytics and effective decision-making (10).
Your BI tool tells you LinkedIn drove $500,000 last month. Your CFO asks how much came from prospects first touched on Google Ads three months earlier. Your BI tool cannot answer that question natively. Your analyst writes custom SQL. The query takes three days. By then, next month's budget is locked.
Know your marketing numbers instantly — or don't decide at all
The market does not wait for your analyst to finish the query. Every delayed decision is a decision your competitor already made.
3. How does the shift from "finding" to "knowing" actually work?
The Answer: The shift requires three structural changes: unified data access, modeled answers instead of raw metrics, and AI that translates plain English into business answers. These are operational capabilities available today, not aspirational concepts.
Stop building dashboards. Start modeling answers.
Harvard Business Review research shows companies with strong data foundations are 2.5 times more likely to improve both decision speed and decision accuracy (9). The difference is not more data or better dashboards. It is a fundamentally different architecture.
Gartner's 2025 data and analytics trends report confirms organizations must move from data-driven to decision-centric (6). Gartner predicts that by 2027, organizations emphasizing AI literacy for executives will achieve 20% higher financial performance (7).
DataCamp's 2026 State of Data and AI Literacy Report found 88% of enterprise leaders say basic data literacy is essential for daily work, yet 60% report a data skills gap. Only 42% provide foundational data literacy training at scale (2).
Gartner further predicts that through 2026, organizations will abandon 60% of AI projects unsupported by AI-ready data — not because the AI failed, but because the underlying data was not structured, trusted, or accessible enough (8).
How it works in 3 steps
Step 1 — Connect your data sources. GA4, Google Ads, CRM, SQL databases, and any platform where your data already lives. No migration required.
Step 2 — Ask your question in plain English. "Which campaign drove the most revenue last quarter?" The AI data modeler translates your question into complex SQL in seconds.
Step 3 — See the modeled answer. One number. One truth. Federated query joins results in real time. No manual reconciliation. No CSV exports.
4. What does "knowing your numbers" look like at the executive level?
The Answer: It means walking into a quarterly board meeting with a single dashboard where every number matches your bank account. It means answering "Which million-dollar channel should we cut?" in 90 seconds with exact attribution. It means you can prove ROI to the board and show your CFO and head of marketing the same truth.
The executive certainty standard
The DRA Intelligence Layer connects to your existing platforms where data already lives. A federated query layer joins results in real time. An AI data modeler turns plain English into modeled business answers. No data migration. No six-week implementation.
Named integrations include GA4, Meta Ads, Google Ads, Shopify, Stripe, Klaviyo, SQL databases, and PDF data sources. Organizations using this federated approach reduce report preparation time by 70% and eliminate manual reconciliation entirely. Most users see their first modeled ROI report in under 15 minutes of connection.
5-model attribution delivers simultaneous reporting from first-touch to U-shaped models. You do not choose one version of the truth. You see them all at once.
5. What are the three use cases that prove this matters?
The Answer: CMOs use it to prove ROI to the board. Marketing directors use it to reallocate budget mid-quarter. Analysts use it to answer complex questions in minutes instead of days.
For the CMO: prove ROI to your CEO
Your CEO asks: "What did our two-million-dollar marketing budget actually produce?" You open one link. You show one dashboard where revenue, attribution, and cost data all match. No disclaimers. No "the platforms show different numbers."
Learn how to prove ROI to your CEO and CFO
For the marketing director: reallocate budget in real time
Your Facebook ROAS drops 20% on Tuesday. You see it Wednesday morning. You move budget to Google and recover the loss by Friday. With a 48-hour report lag, you would not see the drop until Friday. The loss compounds.
For the analyst: stop being a data janitor
Your analyst spends Monday mornings exporting CSV files and Wednesday afternoons reconciling numbers that do not match. With modeled answers, they spend those hours on strategy. The result is higher retention, higher output, and a team that does not burn out.
6. What is the one action that closes the gap today?
The Answer: Stop building more dashboards. Start modeling your data into business answers. The shift from finding to knowing is not about adding another tool to the stack. It is about removing the technical tax that forces your highest-paid people to act as data janitors.
The decision you make today
You have two options. Option one: continue spending an estimated $19,200 per analyst per year on manual data stitching and reconciliation, while your competitors move at the speed of their strategy. Option two: model your data once, serve that truth to every stakeholder, and reclaim 200-plus hours per year for the strategic work your team was hired to do.
The question is not whether your data exists. The question is whether you can access it in 60 seconds or spend another week finding it.
FAQ
Q: How long does DRA take to set up? A: Most users see their first modeled ROI report in under 15 minutes. Connect your platforms via OAuth. No pixels, no tag managers, no engineering required.
Q: Does DRA work with GA4? A: Yes. GA4, Meta Ads, Google Ads, Shopify, Stripe, Klaviyo, SQL databases, and PDF data sources are all supported.
Q: Can my team use it without SQL knowledge? A: Yes. The AI data modeler converts plain English questions into complex SQL. Your team asks in their own words and gets modeled answers.
Q: How is DRA different from a dashboard tool? A: Dashboards show raw data. DRA models your data into business answers with a federated query layer, 5-model attribution, and AI-powered question answering.
Q: Can I try it before committing? A: Start with a free plan. See your first modeled report before deciding.
CTA
Prove your marketing ROI to your CEO
References
Atlassian. (2025). State of Teams 2025. Retrieved from https://www.wonderlabs.ca/news/atlassian-2025-time-tax-enterprise-search
DataCamp. (2026). The State of Data and AI Literacy in 2026: Definitions, Statistics, and the AI Skills Gap. Retrieved from https://www.datacamp.com/blog/the-state-of-data-and-ai-literacy-in-2026-definitions-statistics-and-the-ai-skills-gap
Fluidata. (2025). Data-Driven Decision Making: Why the Shift Matters. Retrieved from https://www.fluidata.co/post/data-driven-decision-making-why-the-shift-matters
Gartner. (2023). Advancing Data Literacy. Retrieved from https://www.gartner.com/peer-community/oneminuteinsights/omi-data-literacy-o7h
Gartner. (2025). Gartner Announces the Top Data & Analytics Predictions. Retrieved from https://www.gartner.com/en/newsroom/press-releases/2025-06-17-gartner-announces-top-data-and-analytics-predictions
Gartner. (2025). Gartner Identifies Top Trends in Data and Analytics for 2025. Retrieved from https://www.gartner.com/en/newsroom/press-releases/2025-03-05-gartner-identifies-top-trends-in-data-and-analytics-for-2025
Gartner. (2025). Lack of AI-Ready Data Puts AI Projects at Risk. Retrieved from https://www.gartner.com/en/newsroom/press-releases/2025-02-26-lack-of-ai-ready-data-puts-ai-projects-at-risk
Harvard Business Review. (2025). The Right Way to Make Data-Driven Decisions (Podcast). Retrieved from https://hbr.org/podcast/2025/03/the-right-way-to-make-data-driven-decisions
IBM. (2024). Chief Data Officer Study. Retrieved from https://www.ibm.com/topics/data-management
MIT IDE. (2012). How Much Time Does the Workforce Spend Searching for Information? Retrieved from https://www.ideals.illinois.edu/items/129980
Nakash, O., & Bouhnik, D. (2024). How Much Time Does the Workforce Spend Searching for Information in the New Normal? ResearchGate. Retrieved from https://www.researchgate.net/publication/379898757_How_Much_Time_does_the_Workforce_Spend_Searching_for_Information_in_the_new_normal
Quickbase. (2025). Inside the 2025 Gray Work Report. Retrieved from https://quickbase.com/blog/inside-the-2025-gray-work-report-investment-in-productivity-tech-is-up-productivity-not-so-much
Slite. (2025). Enterprise Search Survey Report 2025. Retrieved from https://slite.com/en/learn/enterprise-search-survey-findings