
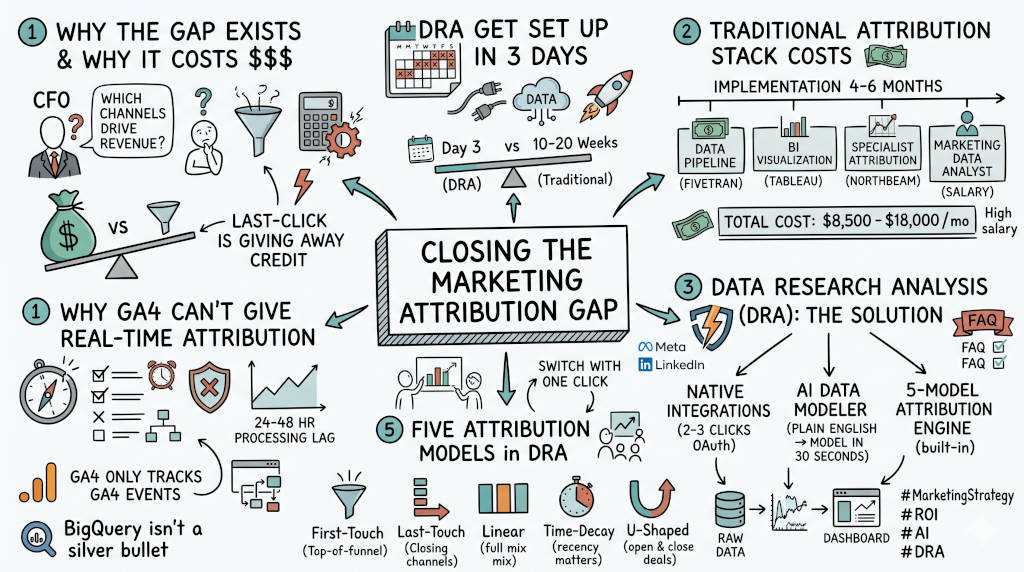
Summary: GA4 cannot tell your CFO which marketing channels drive revenue. Its data lags 48 hours, shifts retroactively for 12 days, and cannot see LinkedIn, email, or CRM touchpoints. Multi-touch attribution fixes this by assigning fractional credit to every touchpoint in the customer journey. Traditional stacks cost $8,500 to $18,000 per month and take 4 to 6 months to implement. DRA delivers five attribution models, AI-powered data modeling, and OAuth integrations for $0 to $319 per month. Setup takes three days.
Your CFO asks one question: "Which channels actually drive revenue?" GA4 cannot answer it. Your team spends 10 hours a week exporting CSVs from five platforms. The report is stale before the meeting starts. Budget decisions run on last-click logic that kills awareness channels. The fix does not require a $50,000 infrastructure.
1. What is multi-touch attribution and why does last-click cost you real money?
The Answer: Multi-touch attribution tracks every marketing touchpoint a customer interacts with before converting and assigns fractional credit to each one. Last-click attribution gives 100% of credit to the final touchpoint. Every channel that warmed the prospect before the click gets zero visible credit.
Why your budget follows the wrong signal
GA4 defaults to last-click attribution. Your LinkedIn ad. Your nurture email. Your organic article. All invisible to the model. Your team scales what gets credit. That is the closing channel. The channels that build awareness and trust get cut. Revenue drops. The CFO blames marketing.
The problem is not your team. The problem is the model. Switch to multi-touch attribution and you see which channels open doors, which channels nurture, and which channels close. You fund all three.
2. Why does GA4 fail at multi-touch attribution?
The Answer: GA4 was built to track site behavior. It was not built to connect marketing spend to revenue across channels. Three architectural facts make this clear. Processing takes 24 to 48 hours. Attribution numbers change retroactively for up to 12 days. GA4 only sees what GA4 touches.
The three constraints Google documents publicly
Processing lag is built in. Google's documentation states standard intraday data takes 2 to 6 hours. Daily data takes up to 48 hours. Attribution processing falls outside the standard SLA and typically takes 4 to 8 hours as a non-standard operation (Google, n.d.-b, n.d.-c).
Attribution credit keeps shifting. Google states directly: "Attribution credit for key events can change for up to 12 days after the key event is recorded" (Google, n.d.-c). The number in Tuesday's board meeting may already be wrong by Thursday.
GA4 cannot see your full marketing mix. Your LinkedIn spend. Your Klaviyo sequences. Your HubSpot CRM data. None of it is visible to GA4 natively. If a customer clicks a LinkedIn ad, opens a Klaviyo email, and converts from a Google Ads click, GA4 attributes only the last click. The rest of the journey disappears.
Why the BigQuery workaround does not solve attribution
Some teams export GA4 data to BigQuery. This speeds up queries. It does not solve attribution. Google confirms that BigQuery's streaming export excludes new user attribution fields entirely. For existing users, attribution data needs approximately 24 hours to process. Standard properties also cap daily export at 1 million events (Google, n.d.-a, n.d.-d).
The truth: GA4 is a strong behavior analytics tool. It was never designed to answer which channels drive revenue. CMOs who treat it as an attribution platform are making budget decisions on incomplete, retroactively shifting data.
3. What does multi-touch attribution look like in practice?
The Answer: Multi-touch attribution assigns a percentage of revenue credit to every touchpoint in the customer journey. You toggle between models to see how credit shifts. First-touch shows which channel finds new customers. Linear shows which channels stay present. U-shaped shows which open and close deals. The truth lives in comparing all five.
The five models and when to use each
First-Touch Attribution. Gives 100% of credit to the first channel. Use this to measure top-of-funnel performance. Answers: which channel finds new customers?
Last-Touch Attribution. Gives 100% of credit to the final touchpoint. The GA4 default. It undervalues awareness. Never use it alone.
Linear Attribution. Spreads credit equally across all touchpoints. Use this to see which channels show up throughout the customer lifecycle.
Time-Decay Attribution. Gives more credit to touchpoints near conversion using a 7-day half-life curve. Use this when recency signals purchase intent.
U-Shaped Attribution. Gives 40% to first touch, 40% to last, and spreads 20% across the middle. Built for B2B with long sales cycles. Answers: which channels open and close deals?
Run all five at once. Compare side by side. The model that shows the widest spread between channels is often the one revealing budget misallocation. This is your "Truth Gap." Close it.
4. What does it cost to build attribution with traditional tools?
The Answer: A traditional multi-touch attribution stack needs four components: a data pipeline, a cloud warehouse, a BI layer, and an analyst. Published pricing puts the monthly cost at approximately $8,500 to $18,000 for a mid-sized team.
The component breakdown with published pricing
Component | Tool Example | Verified Cost |
|---|---|---|
Data pipeline | Fivetran | ~$549/month for 4 connectors at median usage (Fivetran, 2025) |
BI layer | Tableau Cloud | $15/user/month. 10 users: $150/month minimum, scaling with headcount (Tableau, 2025) |
Attribution platform | Northbeam | Starts at $1,500/month for <$1.5M/year media spend. Enterprise requires custom pricing (Northbeam, 2025) |
Marketing data analyst | Salary | $63K to $109K/year in the U.S. Loaded monthly cost: ~$6,500 to $11,500 (Glassdoor, 2025) |
Total: $8,500 to $18,000 per month. And that is before any custom work. Most teams spend 4 to 6 months in implementation before seeing the first report. Your competitors are making budget decisions every single one of those weeks.
What teams do instead
Three common workarounds. All three fail the same way.
Workaround 1: GA4's built-in attribution. Free. But GA4 cannot see LinkedIn, email, CRM data, or offline touchpoints. Numbers change for up to 12 days retroactively (Google, n.d.-c).
Workaround 2: Export CSVs into Excel. The most common path. Export from Google Ads. Export from HubSpot. Export from LinkedIn. Combine manually. The report is stale before the meeting. No audit trail. Any error corrupts the model.
Workaround 3: Hire an analyst. Works technically. But the timeline is still long. Loaded analyst cost: $6,500 to $11,500 per month (Glassdoor, 2025). Plus tool subscriptions and maintenance.
None of these give your CFO what they ask for: a defensible number that connects spend to the bank account.
5. What does real-time attribution actually require technically?
The Answer: Three things must work together. All marketing data must sit in one place. The attribution engine must run multiple models at once. The output must be readable by a non-technical marketing leader. When any one of these is missing, attribution is incomplete.
Why traditional tools fail on all three
Data pipelines unify data. BI tools display it. But wiring together attribution models, cross-source joins, and a no-code interface has historically required a technical team. That is where the cost and delay live.
The platform that fixes this must be built for marketers. Not adapted from a general BI tool. Not bolted onto a CRM. Built to answer one question: which channels produce revenue?
6. How does DRA deliver multi-touch attribution without the $50k infrastructure?
The Answer: Data Research Analysis is built for marketing executives who must prove ROI to a CFO. It connects to Google Ads, GA4, Ad Manager, and LinkedIn Ads via OAuth. Five attribution models run simultaneously. The AI Data Modeler turns plain English into complete data models in under 30 seconds. No SQL. No data engineer. Start Monday. First attribution report by Wednesday.
What replaces each piece of the old stack
Replaces the data pipeline. DRA connects directly to Google Ads, GA4, Google Ad Manager, and LinkedIn Ads through OAuth. No Fivetran subscription. No third-party pipeline cost.
Replaces the analyst. Describe what you need: "Show ROI by channel for 90 days." The AI builds the join logic, the attribution structure, and the output. Ready in under 30 seconds. Not 6 months.
Replaces the specialist platform. Five attribution models built in: first-touch, last-touch, linear, time-decay, U-shaped. Switch between them with one click. No implementation timeline. No minimum spend.
Replaces the BI layer. Dashboards your CFO can read. PDF export. Public share links for stakeholders who do not log in. The platform runs on a Medallion Architecture. Data moves from raw to structured to attribution-ready without manual steps.
7. How fast can a team get set up compared to the traditional path?
The Answer: Three days. Connect Google Ads and GA4 on Day 1. Build your first model with the AI Data Modeler on Day 2. Share with your CFO on Day 3. No IT involvement. No data engineer. No 6-month project plan.
The traditional timeline for comparison
Standard BI build-out: vendor scoping 2 to 4 weeks. Procurement 2 to 4 weeks. Data engineering 4 to 8 weeks. Dashboard build 2 to 4 weeks. Total: 10 to 20 weeks before the first report. Competitors shift budgets during all 20 of those weeks.
8. Who does DRA serve?
The Answer: CMOs and VPs of Marketing at B2B companies who must prove ROI to a CFO but do not have a data engineering team. It is not built for enterprise data warehouse teams or SOC 2 regulated industries.
The four roles who gain most
CMOs and VPs of Marketing. Walk into CFO reviews with defensible multi-touch data. Stop presenting pie charts that produce more questions than answers.
Marketing Directors and Campaign Managers. Stop spending Monday mornings exporting CSVs across five platforms. Stop spending 10 hours a week building a report that ages out by Thursday.
Founders and Growth Leaders. Too big for GA4. Too small for a $50,000 infrastructure. DRA closes the gap at a price that fits a marketing budget.
CFOs and Finance Leaders. Marketing must prove ROI before the next budget cycle. DRA gives marketing the tools to produce that proof without a six-figure infrastructure investment.
9. What does DRA cost compared to enterprise tools?
The Answer: DRA offers a free plan with the full attribution engine and AI Data Modeler. Paid plans start at $23 per month. The Professional Plus plan at $319 per month covers teams of up to 100 users. All pricing is published (Data Research Analysis, 2025). Enterprise attribution platforms start at $1,500 per month with minimum spend thresholds (Northbeam, 2025).
Pricing tiers
Plan | Monthly (Annual) | Users | Includes |
|---|---|---|---|
FREE | $0 | Solo | 5 models, AI Data Modeler, 50K rows per model |
STARTER | $23 | Solo | 500K rows, 15 sources, advanced attribution |
PROFESSIONAL | $103 | 2 to 5 | 5M rows, unlimited projects, team tools |
PROFESSIONAL PLUS | $319 | 6 to 100 | 100M rows, RBAC, API access, priority support |
ENTERPRISE | Custom | 100+ | Unlimited rows, SAML SSO, white-glove onboarding |
(Data Research Analysis, 2025)
For context: Northbeam starts at $1,500 per month with media spend minimums (Northbeam, 2025). DRA's Professional Plus plan at $319 per month delivers comparable multi-touch attribution. No minimum spend. No per-seat fees. No usage-based connector charges.
FAQ
Q: Does DRA replace GA4? A: No. DRA connects to GA4 as a source via OAuth. GA4 still collects your behavior data. DRA joins that with your ads, CRM, and email data into unified attribution models GA4 cannot produce alone.
Q: Is GA4 free attribution good enough? A: GA4 gives you last-click attribution on partial data with a 48-hour lag. The numbers change for 12 days after collection. It cannot see LinkedIn, email, or CRM touchpoints. If your budget exceeds what you would bet on a coin flip, GA4 alone is not enough.
Q: Do I need a data engineer? A: No. OAuth connections take two to three clicks. The AI Data Modeler builds models from plain English. No SQL. No DAX.
Q: How is DRA different from Tableau or Power BI? A: Tableau and Power BI are general BI tools. They need SQL expertise and analyst time to build attribution. DRA ships with five models pre-built. Tableau Cloud starts at $15 per user per month (Tableau, 2025) with no built-in attribution. DRA Professional is $103 per month for a team of five with attribution on Day 1.
Q: Is my data secure? A: OAuth tokens encrypted at rest with AES-256. GDPR compliant with cookie consent and IP anonymization. Official Meta Technology Provider. LinkedIn Verified Business.
See the numbers your CFO actually needs
Your boardroom question has a specific answer. Explore how DRA closes the gap between spend and proof at dataresearchanalysis.com/strategic-velocity.
References
Data Research Analysis. (2025). Pricing. https://www.dataresearchanalysis.com/#pricing
Fivetran. (2025). Pricing. https://www.fivetran.com/pricing
Glassdoor. (2025). Marketing data analyst salaries. https://www.glassdoor.com/Salaries/marketing-data-analyst-salary-SRCH_KO0,22.htm
Google. (n.d.-a). BigQuery Export overview. Google Analytics Help. https://support.google.com/analytics/answer/9358801
Google. (n.d.-b). Attribution reporting: Data freshness and SLA. Google Analytics Help. https://support.google.com/analytics/answer/12233314
Google. (n.d.-c). Data freshness. Google Analytics Help. https://support.google.com/analytics/answer/11198161
Google. (n.d.-d). Set up BigQuery Export. Google Analytics Help. https://support.google.com/analytics/answer/9823238
Northbeam. (2025). Pricing. https://www.northbeam.io/pricing
Tableau. (2025). Tableau pricing for teams and organizations. https://www.tableau.com/pricing/teams-orgs
Data Research Analysis is an AI-powered marketing analytics platform built for CMOs and marketing executives. Multi-touch attribution, AI data modeling, and cross-channel reporting. Official Meta Technology Provider. LinkedIn Verified Business. dataresearchanalysis.com


