
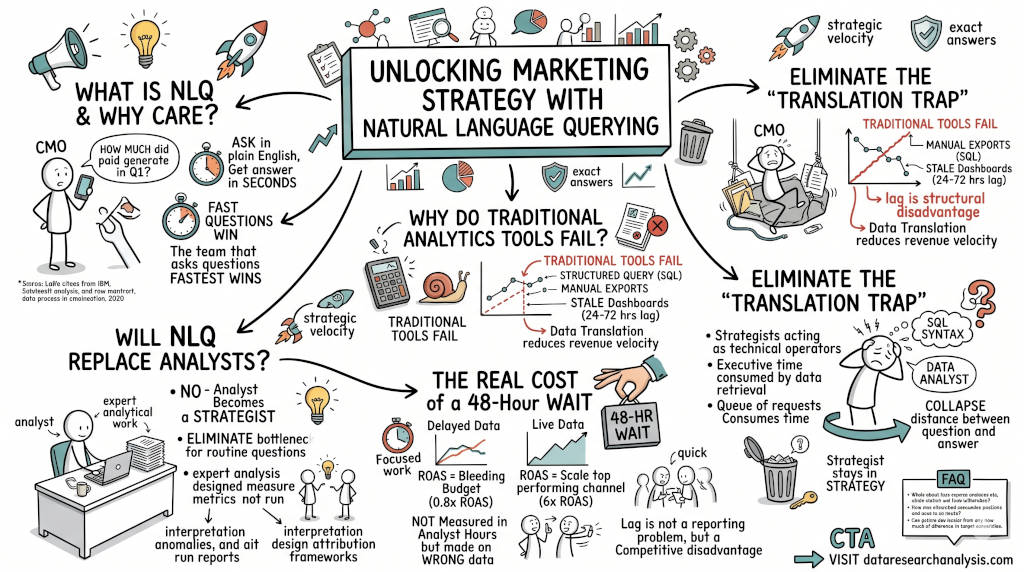
Summary: Natural language querying lets enterprise CMOs ask their marketing data questions in plain English and get answers in under a minute — no SQL, no analyst ticket, no 48-hour GA4 lag. The competitive landscape is already live: Pinterest, Microsoft, MixPanel, and Amplitude have all shipped NLQ. But NLQ fails when you automate the question interface before structuring the data underneath. DRA's AI Data Modeler solves this by auto-inferring schema relationships, generating transparent multi-source queries, and surfacing AI insights — anomalies, trends, and correlations — before you ask. The analyst queue drops from three days to zero. Your team stops translating data and starts acting on it.
Your team files a ticket to answer a campaign question. The analyst queue is three days deep. By the time the report lands, the market has already moved. You hired strategists. You are funding a translation service. Natural language querying ends the queue. Ask your data a question in English. Get an answer in seconds. No SQL. No ticket. No wait. The team that asks questions fastest wins the quarter.
1. What is natural language querying and why should every CMO need it?
The Answer: Natural language querying (NLQ) lets you ask your marketing data a question in plain English and receive a modeled answer in under a minute. No SQL knowledge required. No analyst ticket filed. No 48-hour wait for a GA4 report to finalize. For an enterprise CMO running 10 or more data platforms, NLQ is not a convenience feature. It is the difference between a decision made on live data and one made on stale evidence (Google, n.d.).
The language of data has always excluded the people who need it most
Marketing leaders run multi-million dollar budgets. They own campaign strategy, attribution, and board-level reporting. Yet the one question that drives every decision — "What is actually working right now?" — has always required a technical middleman to answer.
SQL is the language of databases. It is not the language of strategy.
A CMO should not need SELECT SUM(revenue) FROM campaigns WHERE channel = 'paid' to answer "How much did our Q3 paid channels generate?" That question should be asked in English and answered before the next meeting starts.
IBM defines NLP as a subfield of AI that "enables computers to understand and communicate with human language" (IBM, n.d.-a). The machine now speaks your language. You stop speaking its.
The marketing office that still routes every data question through an analyst queue is not running a strategy operation. It is running a translation service.
2. Who is already doing NLQ in marketing analytics?
The Answer: The market is moving fast. Pinterest built Text-to-SQL to convert plain-language questions into database queries. Microsoft added Copilot to Power BI and Excel. MixPanel launched Spark for conversational analytics. Amplitude built Ask Amplitude. Google added Conversational Analytics to Looker Studio with Gemini. Cube acquired Delphi Labs for AI-driven self-serve analytics. These are not startups testing concepts. These are platforms your competitors already use to ask their data questions and get answers in seconds (IBM, n.d.-b).
What the competitive landscape tells you
Pinterest Engineering documented their Text-to-SQL implementation publicly: "We took the rise in availability of Large Language Models as an opportunity to explore whether we could assist our data users with this task by developing a Text-to-SQL feature which transforms analytical questions directly into code" (Pinterest Engineering, 2024).
Microsoft Copilot now lets users in Power BI describe a report in plain English and receive a generated dashboard. MixPanel Spark answers product and revenue questions conversationally without requiring any platform knowledge.
Growth Method, a marketing experiment platform, connected GA4, PostHog, MixPanel, and Amplitude to NLQ so teams can "talk with their marketing data using natural language" (Brameld, 2025).
Every major analytics vendor is racing to add NLQ. The question for the CMO is not "should I adopt this." It is "which platform gives me the fastest path to live, federated data without waiting for my vendor to ship it."
3. What makes NLQ fail and how do you prevent it?
The Answer: NLQ fails when you automate the question interface before you structure the data underneath it. AI tools can only answer from what they can read. When the underlying data is inconsistent, siloed, or manually curated, the NLQ produces confident-sounding answers from unreliable numbers. Your team loses trust in under a month. The tool gets abandoned by quarter two. The failure is not the AI. The failure is the data foundation (Gartner, 2022).
The two failure patterns every CMO will face
Pattern one: tool-first thinking. You buy an NLQ dashboard or a conversational BI add-on. It produces answers faster. But it reads from raw, unreconciled exports spread across Google Ads, Meta, GA4, and your CRM. The AI inherits the mess. Your team spends as much time verifying the output as they did building the manual report.
Pattern two: black-box answers. The NLQ returns a number. You ask how it calculated that number. It cannot show you. No query transparency. No source lineage. No audit trail. You present that number to your CFO. They find a discrepancy with the bank account. Trust is gone in one meeting.
Organizations that link AI to structured data workflows report 2 to 3 times higher value from AI initiatives than those that deploy AI on unstructured data (Singla et al., 2025).
The verification standard
Every NLQ deployment that survives production has three properties:
Query transparency: the generated SQL is visible and auditable
Source lineage: every number shows which platform it came from and when it was last refreshed
Schema awareness: the AI understands how your data is connected before it answers a question
If your NLQ vendor cannot show you the query it ran, the source it pulled from, and the timestamp of the data, you do not have a decision tool. You have a black box. Black boxes lose boardroom trust by month three.
4. Do you need NLQ or just better dashboards?
The Answer: The threshold depends on four factors. If your team manages fewer than 5 data platforms and your current dashboards answer every question leadership asks, NLQ is overkill. If you manage 10 or more platforms, your analysts run a backlog of ad-hoc queries, and your dashboards cannot answer Tuesday morning's follow-up questions, you have crossed the NLQ threshold. You are not buying convenience. You are fixing a structural bottleneck that costs real decision velocity (Sergeev, 2026).
The decision diagnostic
Factor | Stay with dashboards | Graduate to NLQ |
|---|---|---|
Data sources | Under 5 platforms | 10+ platforms across ad, CRM, analytics, finance |
Analyst queue | Questions answered same day | Ad-hoc requests backlogged 2+ days |
Query complexity | Pre-built reports cover 80% of needs | Leadership asks questions dashboards cannot answer weekly |
Team size | Under 10 marketers, one analyst | 10-50 marketers, multiple analysts with queues |
Spend scale | Under $500K annual marketing spend | Over $1M annual spend with optimization value |
If you have crossed three or more of these thresholds, NLQ is not a luxury. It is a competitive requirement.
5. What does the time recovery look like for an enterprise marketing team?
The Answer: A marketing team of 10 managing 10+ platforms generates manual reporting tasks across extraction, cleaning, joining, and publishing. A federated NLQ layer removes the manual steps in that chain. Most teams reclaim 6 to 8 hours per person per week. At a fully-loaded analyst cost of $60 per hour, that is $18,000 to $24,000 per analyst per year shifted from maintenance to strategy (Salesforce, 2024).
The before vs after
Task | Before NLQ | After NLQ |
|---|---|---|
Data extraction | 2 to 3 hours across platforms | 10 to 15 minutes, one query |
Cleaning and joining | 2 to 3 hours reconciling discrepancies | 20 to 30 minutes, automated |
Report building | 2 to 3 hours formatting for board | 20 to 30 minutes, auto-generated |
Ad-hoc questions | 3-day analyst queue | Under 60 seconds, typed in English |
Executive export | 30 minutes per report version | Automated |
How to prove the recovery to your CFO
Run a two-week time ledger. Track every recurring task: CSV exports, VLOOKUP fixes, join repairs, deck updates, ad-hoc query tickets. Automate one bucket at a time with NLQ. Remeasure. Present hours returned to campaign optimization and strategy. Keep the ledger visible in weekly leadership reviews.
Salesforce surveyed 4,500 marketing leaders globally in its 10th Edition State of Marketing report. The finding is direct: 83% of marketers recognize the urgent need for data-driven personalization. Only 1 in 4 are satisfied with how they actually use data to power decisions (Data Research Analysis, 2026a). That gap is not a skills problem. It is an infrastructure problem. NLQ closes it at the source.
6. What makes the AI Data Modeler different from a generic NLQ tool?
The Answer: Generic NLQ tools convert English to SQL and stop there. DRA's AI Data Modeler, powered by Gemini 2.0, does three things no generic tool does. First, it auto-infers your schema — it understands how your GA4 events relate to your CRM contacts without a human mapping them. Second, it writes complex joins across federated sources in a single query. Third, it shows you the query it generated so you can verify every number before it reaches a boardroom. This is not a chatbot bolted onto a dashboard. It is an AI-native query engine that replaces the analyst queue permanently (Data Research Analysis, 2026b).
How the AI Data Modeler thinks
The Data Modeler does not guess. It reasons across your schema in three steps.
Step one: schema inference. When you connect Google Ads, Meta, GA4, and your CRM, the Data Modeler scans column names, data types, and value distributions. It infers that ga4.user_id maps to crm.contact_id. It learns that meta.campaign_name is the same entity as google_ads.campaign but uses different spelling. It builds the join map automatically. No human writes a single mapping rule.
Step two: query generation. You type "Compare ROAS for all paid channels against our targets, weighted by spend." The Data Modeler generates a multi-source SQL query that joins ad spend from three platforms, pulls conversion data from your CRM, applies your target ROAS thresholds, and returns a ranked table. Query generation time: under 5 seconds.
Step three: transparency. Every query is visible. You see the SQL. You see each source it touched. You see the timestamp of every data point. When your CFO asks "Where did this number come from?" you answer in one click. No black box. No trust gap.
AI insights that catch what humans miss
The AI Data Modeler does not just answer the question you asked. It surfaces the question you should have asked.
Anomaly detection. A channel that produced 2.8x ROAS last quarter drops to 0.9x this week. Your dashboard still shows green. The Data Modeler flags the deviation before you open the report. You investigate before the weekly budget call. You stop bleeding spend on a Monday instead of discovering it on a Thursday.
Trend acceleration. A new audience segment shows conversion rates climbing 40% week-over-week for three consecutive weeks. The Data Modeler surfaces the trend and recommends budget reallocation. You scale into the signal before it peaks. Your competitor's analyst is still building the query.
Correlation detection. Email open rates correlate with paid search conversion rates at a 0.7 coefficient in your data. The Data Modeler identifies the relationship. You adjust your cross-channel strategy. You stop optimizing channels in isolation and start optimizing the system.
These are not pre-built alerts on a dashboard. They are live signals generated by a model that reads your data continuously and reports what matters before you ask.
What the Data Modeler replaces
What your team does today | What the Data Modeler does |
|---|---|
Files a ticket to pull channel ROAS | Answers in under 5 seconds, typed in English |
Writes SQL joins across 3 platforms | Auto-infers all relationships, writes the join |
Manually checks for naming mismatches | Learns your taxonomy and normalizes automatically |
Spots anomalies by reviewing dashboards daily | Flags deviations the moment they cross thresholds |
Builds attribution models in spreadsheets | Calculates 5-model attribution on demand |
Verifies numbers against the bank account | Reconciles spend to revenue in the same query |
This is the future of the marketing office. Your strategist asks a question in English. The AI Data Modeler answers with financial-grade precision. The meeting starts with certainty, not debate. That is what gets you out of the Technical Translation Trap and into strategic velocity.
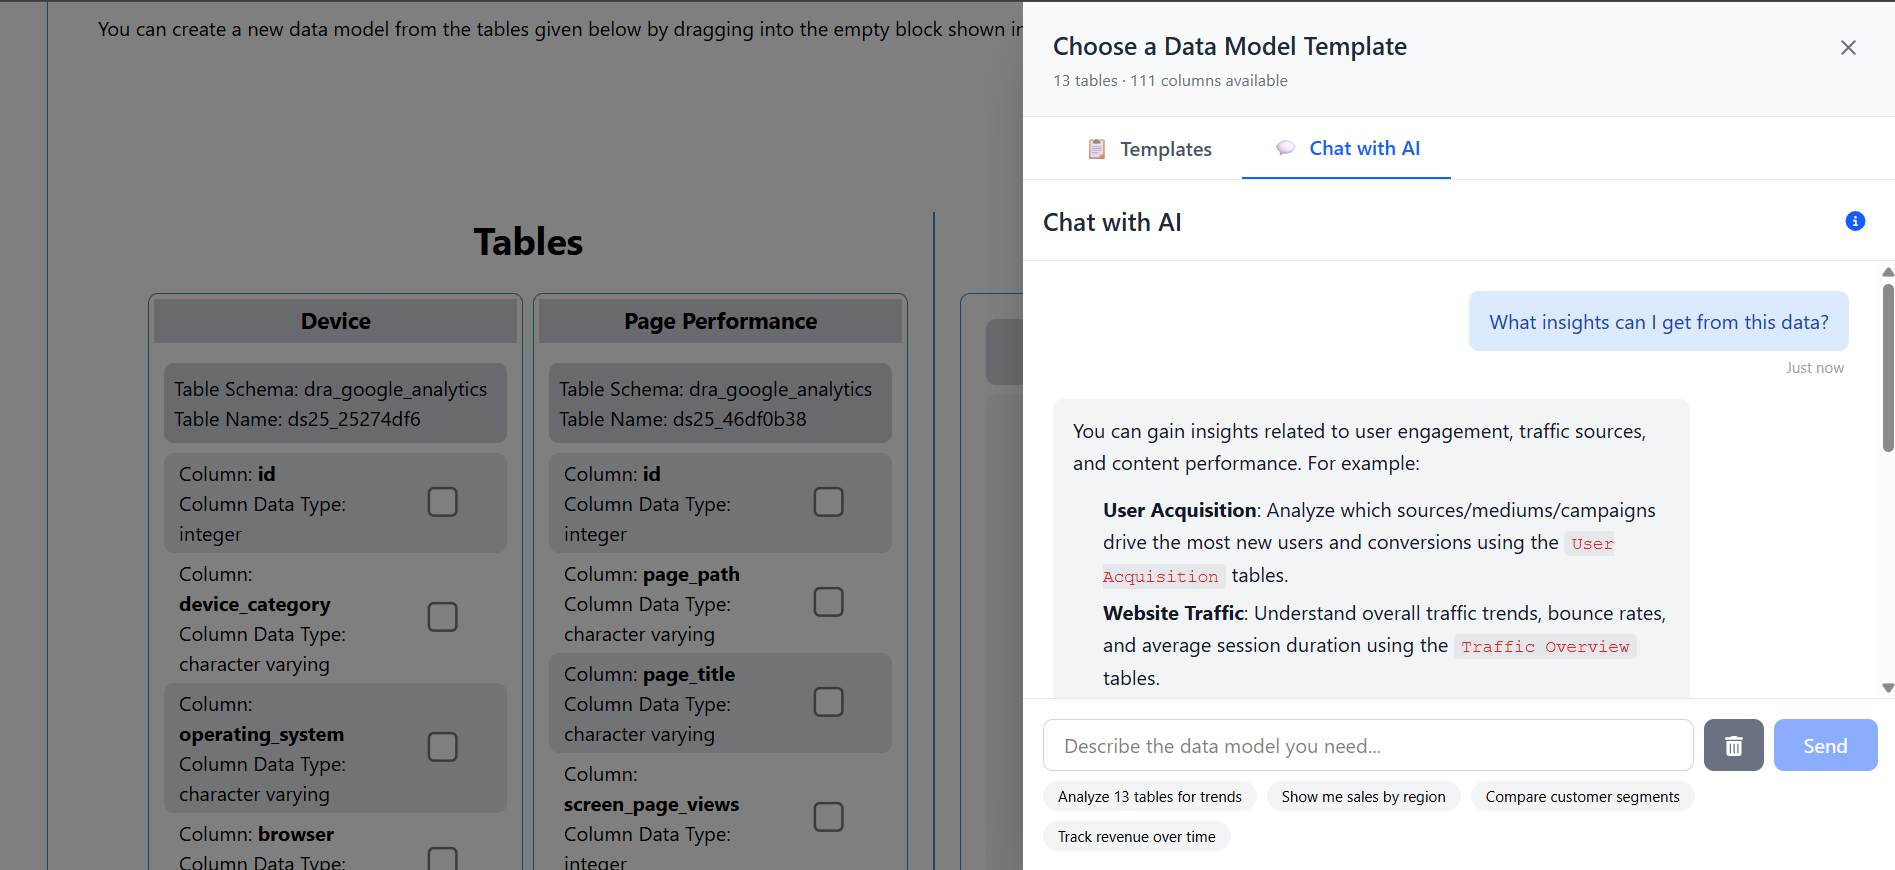 AI Data Modeler in action in Data Research Analysis Marketing Intelligence Platform
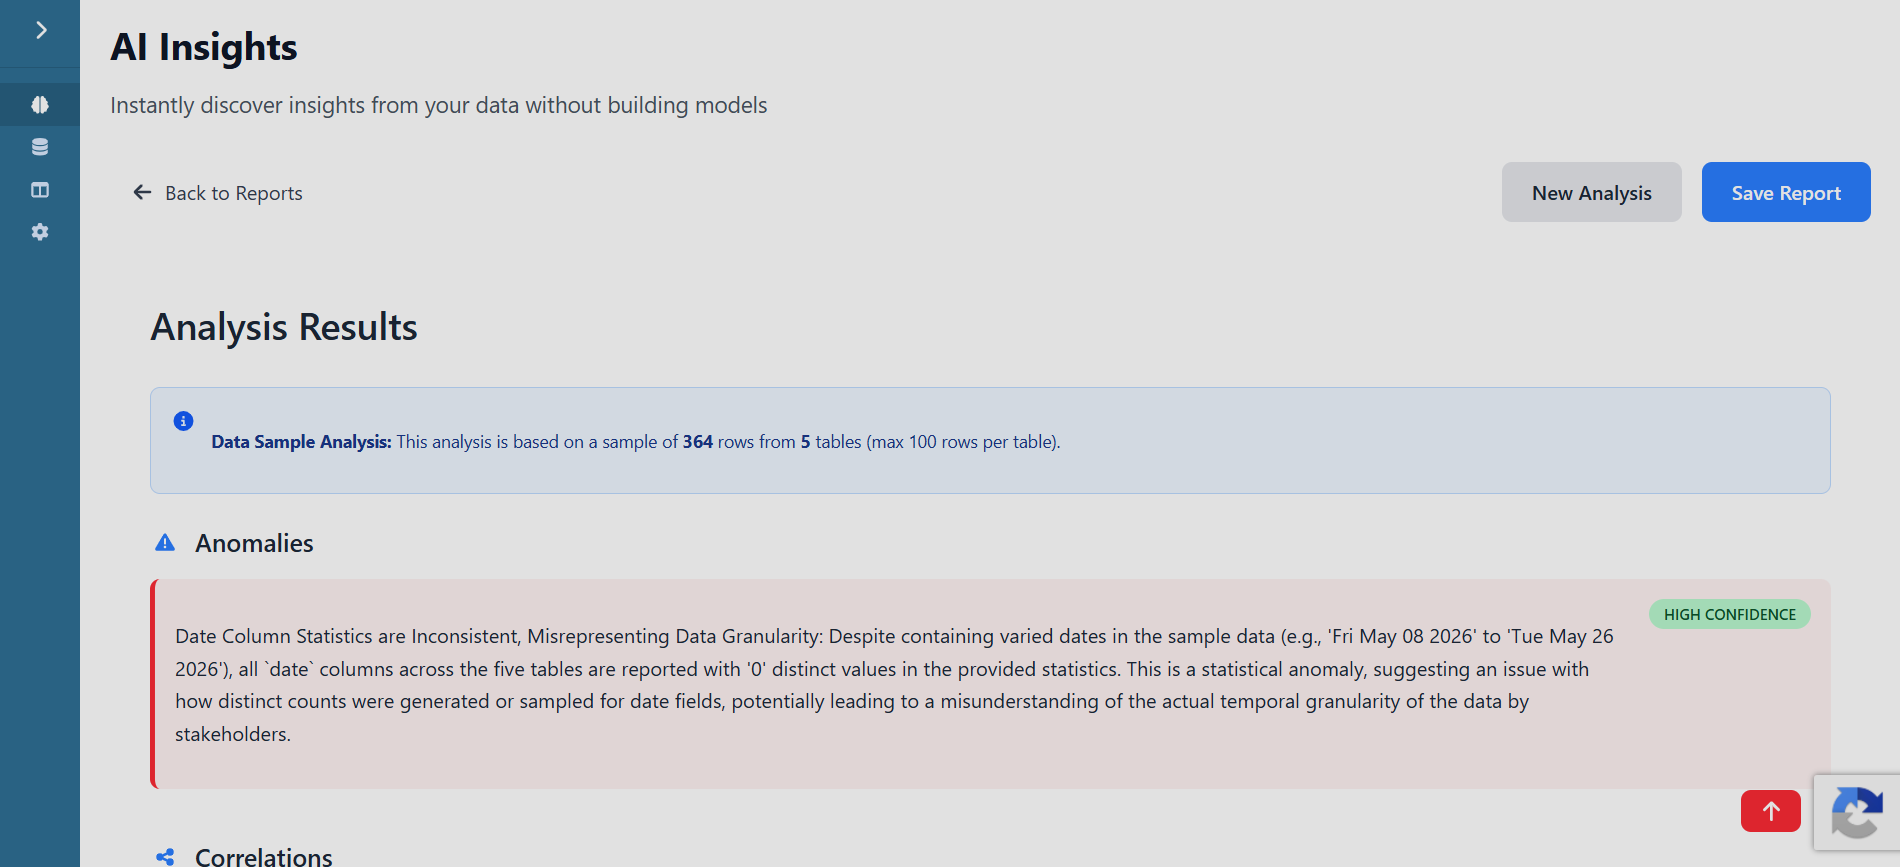 AI Insights Data Research Analysis Marketing Intelligence Platform
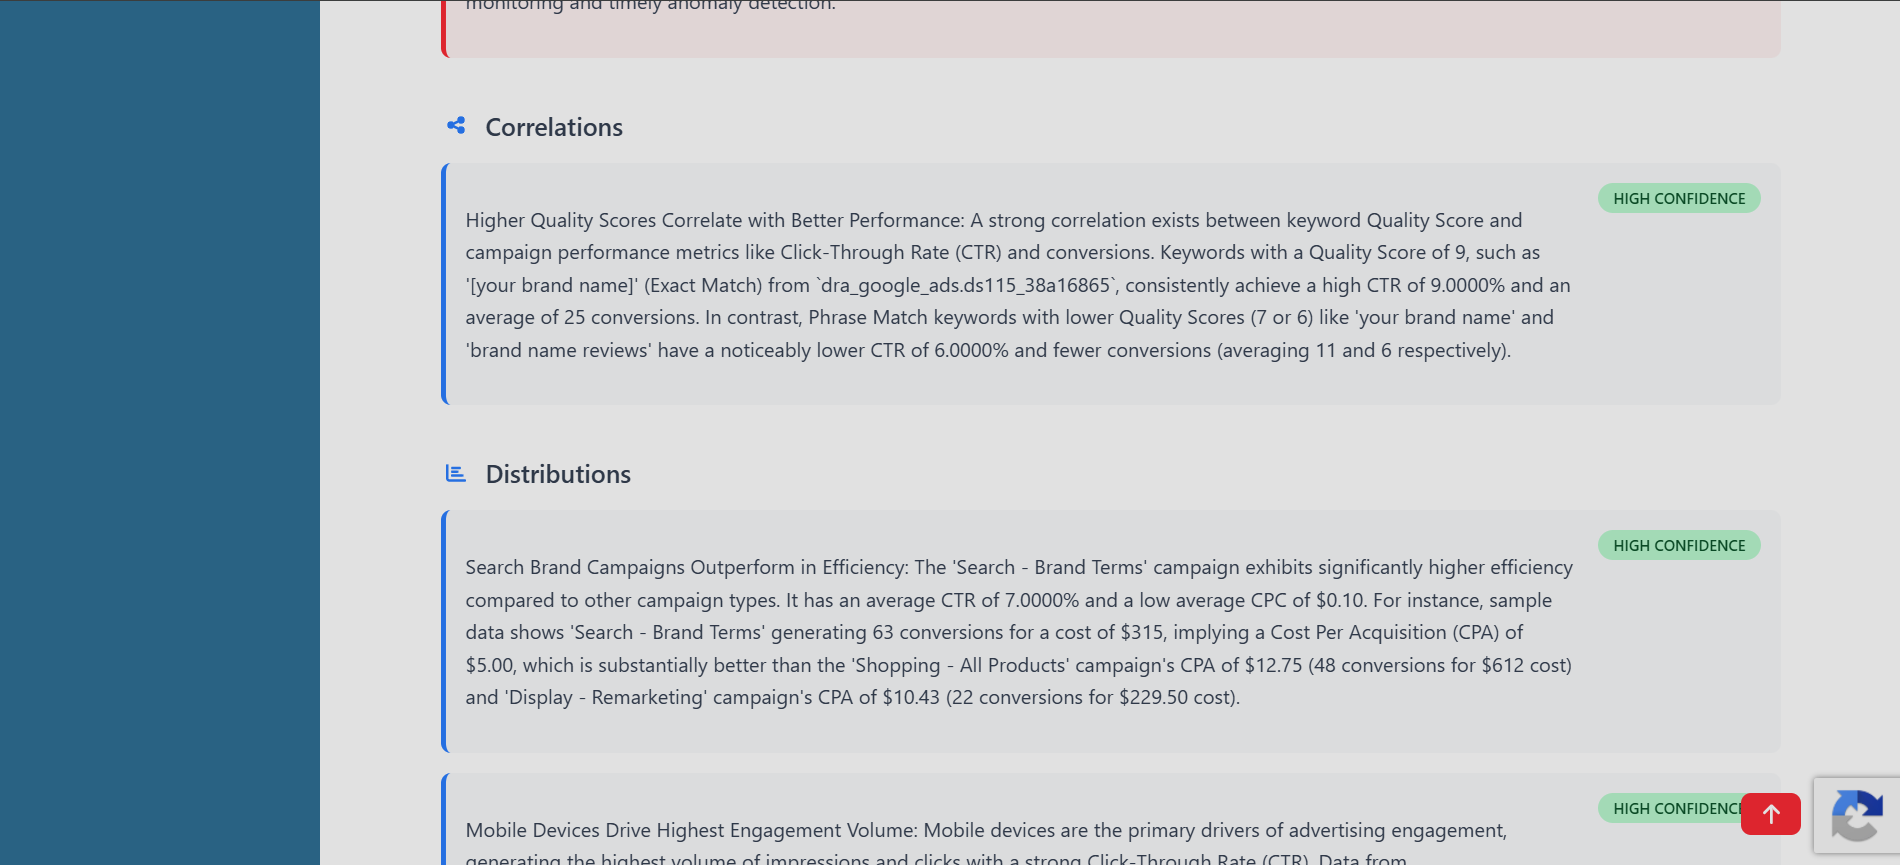 AI Insights Data Research Analysis Marketing Intelligence Platform
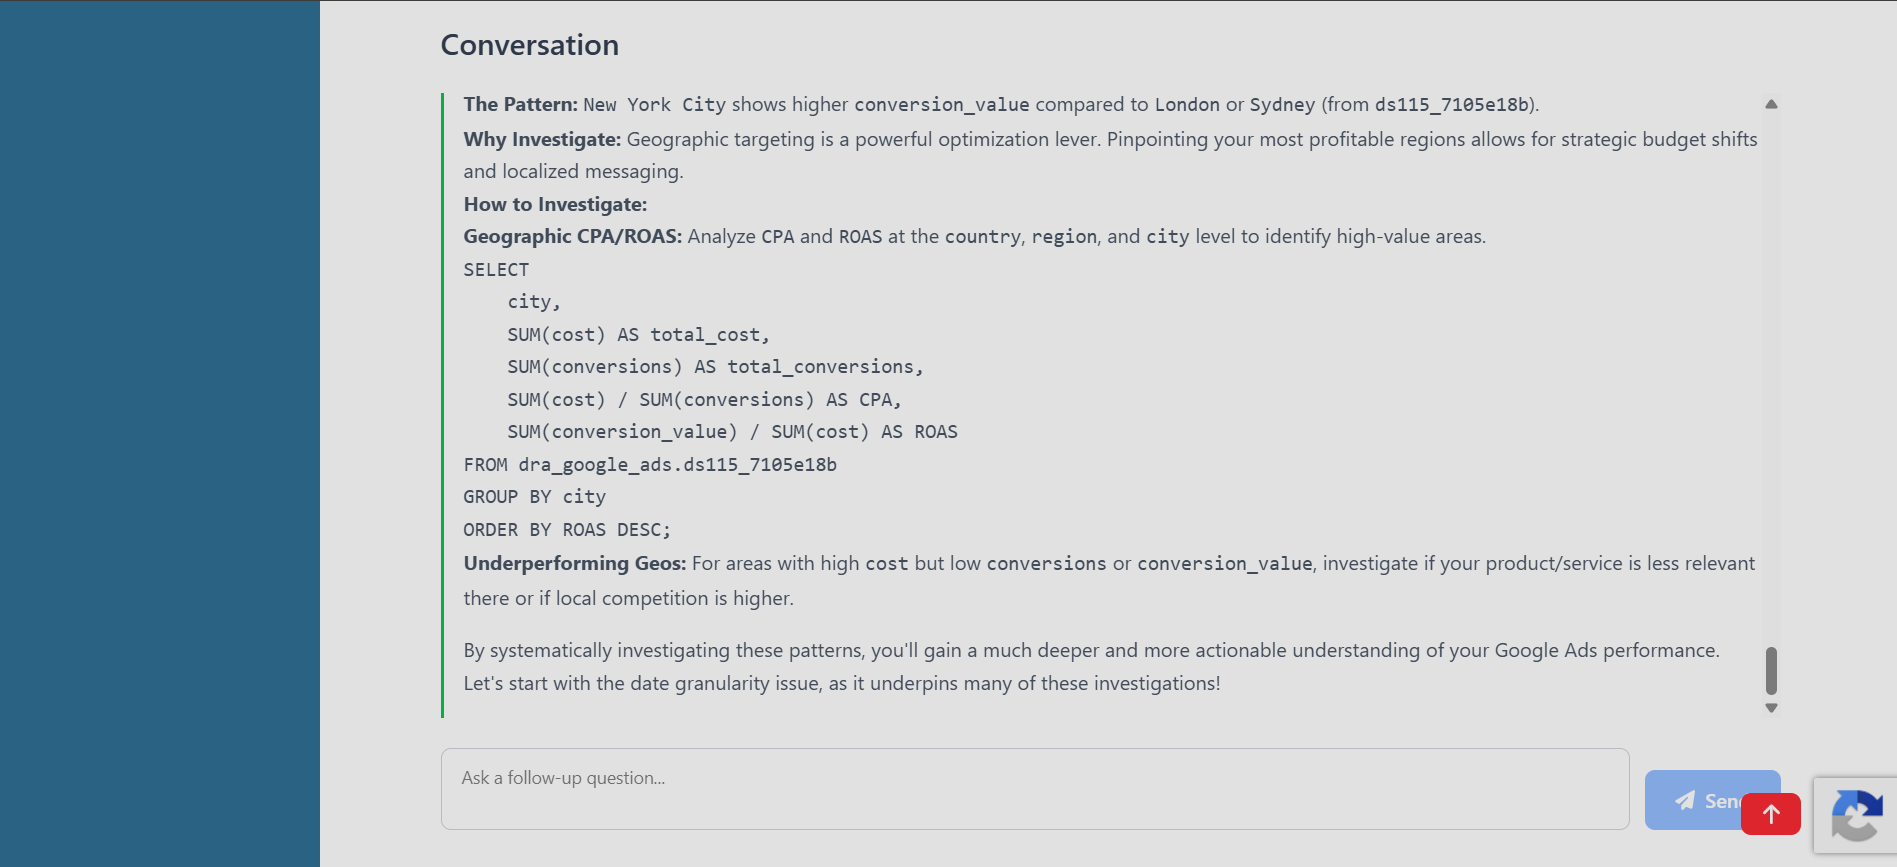 AI Insights Data Research Analysis Marketing Intelligence Platform
7. What is the implementation timeline and cost?
The Answer: A federated NLQ layer deploys in 1 to 2 weeks, not 2 to 6 months. You connect your existing platforms with OAuth. The system auto-infers your schema and data relationships. You ask your first question in plain English within days of starting. This is not a warehouse build. It is not a data engineering project. It layers on top of your current stack and reads from it directly ([Reference 14 missing from reference list]).
Implementation phases
Phase 1: Connect (Days 1-3). OAuth to Google Ads, Meta, GA4, your CRM, and any SQL databases. One click per source. No API keys. No engineering queue.
Phase 2: Verify (Days 4-7). Ask baseline questions you already know the answers to. Verify the output matches your existing numbers. The system shows you the query it ran so you confirm accuracy before trusting new questions.
Phase 3: Operate (Week 2+). Your team asks questions in English. Answers return in under a minute. The analyst queue drops. Time reclaimed moves to strategy.
Cost comparison
Approach | Time to first answer | Monthly cost | Maintenance burden |
|---|---|---|---|
Manual (current) | 3 days (analyst queue) | Salary cost of queue time | 10-15 hrs/week cleaning |
Self-build NLQ | 4 to 6 months | $15K-$30K/month (engineer + infrastructure) | Full-time data engineer |
Federated platform (DRA) | 1 to 2 weeks | Platform pricing | Zero: auto-healing connections |
8. FAQ
Q: Can we do NLQ without replacing every existing tool? A: Yes. A federated query layer reads from your current platforms where they live. You keep your stack. The NLQ layer sits on top. No migration. No rip-and-replace.
Q: What if the AI generates a wrong answer? A: A well-architected NLQ system is transparent. You see the SQL it generated. You verify the source it queried. You check the data timestamp. Black-box NLQ is a risk. Inspectable, auditable NLQ is a standard. Never deploy NLQ that cannot show its work.
Q: How long until leadership sees measurable time return? A: Most teams see clear change within one reporting cycle — typically 2 to 4 weeks. Run a time ledger before and after. The difference is visible at the first weekly review.
Q: Is NLQ only for large enterprise teams? A: The business case is strongest for mid-market teams with no dedicated data engineering resources. A five-person team losing 10 hours weekly to reporting has lost 25 percent of its total strategic capacity. Enterprise teams with mature data functions use NLQ to extend self-service access across more team members.
Q: How is this different from asking ChatGPT about my marketing data? A: ChatGPT has no access to your actual campaign numbers. It responds from general training data. A purpose-built NLQ layer connects to your live data environment and queries it directly. The answer reflects your real spend, your real conversions, and your real revenue.
Q: What does this cost if we do nothing? A: At $60 per hour per team member, 10 hours weekly across a 10-person team equals $600 per week. That is $2,400 per month. Over a year, $28,800. The cost of inaction is a junior salary burned on data plumbing. That number excludes the cost of decisions made on stale data.
Q: Can NLQ work if my data lives in 10 different systems with different schemas? A: Yes — if the underlying platform supports federated queries. Magic Joins auto-infer the relationships between your Google Ads user IDs and your CRM records. The Federated Query Layer joins GA4, ad platforms, and SQL databases without moving data into a single warehouse first. Without federated architecture, NLQ only reads a fraction of your actual marketing data.
Q: How does NLQ connect to proving ROI to my CFO? A: NLQ answers the spend-to-revenue question instantly. You type "What was our true CAC by channel last month?" and receive a number that reconciles to your P&L because it pulls from the same sources your finance team trusts. The boardroom meeting starts with certainty, not debate.
References
Google. (n.d.). [GA4] Data freshness. Google Analytics Help. https://support.google.com/analytics/answer/11198161
IBM. (n.d.-a). What is NLP (natural language processing)? IBM Think. https://www.ibm.com/think/topics/natural-language-processing
IBM. (n.d.-b). What is conversational analytics? IBM Think. https://www.ibm.com/think/topics/conversational-analytics
Pinterest Engineering. (2024). How we built Text-to-SQL at Pinterest. Medium. https://medium.com/pinterest-engineering/how-we-built-text-to-sql-at-pinterest-30bad30dabff
Brameld, S. (2025, April 30). Natural language processing and AI in marketing analytics. Growth Method. https://growthmethod.com/ai-in-marketing-analytics/
Gartner. (2022, August 31). Gartner predicts conversational AI will reduce contact center agent labor costs by USD 80 billion in 2026. https://www.gartner.com/en/newsroom/press-releases/2022-08-31-gartner-predicts-conversational-ai-will-reduce-contac
Singla, A., Sukharevsky, A., Yee, L., Chui, M., & Hall, B. (2025, March 12). The state of AI: How organizations are rewiring to capture value. McKinsey & Company. https://www.mckinsey.com/capabilities/quantumblack/our-insights/the-state-of-ai-how-organizations-are-rewiring-to-capture-value
Sergeev, S. (2026, June 2). Business intelligence for marketing: Complete guide for 2026. Improvado. https://improvado.io/blog/business-intelligence-for-sales-and-marketing
Salesforce. (2024). State of marketing (10th ed.). Salesforce Research. https://www.salesforce.com/resources/research-reports/state-of-marketing/
Data Research Analysis. (2026a). The report lag: Why you are making decisions on 48-hour-old data. https://www.dataresearchanalysis.com/articles/the-report-lag-why-you-are-making-decisions-on-48-hour-old-data
Data Research Analysis. (2026b). The technical translation trap: Stop being IT support for dashboards. https://www.dataresearchanalysis.com/technical-translation-trap


